BHP Share Price on Tuesday: Slides 4.95%, Near a 3-Month Low
Technical analysis of BHP stock on November 17, 2026: price 54.38 AUD, trend downtrend, RSI 36.8, support 54.38, resistance 60.39.
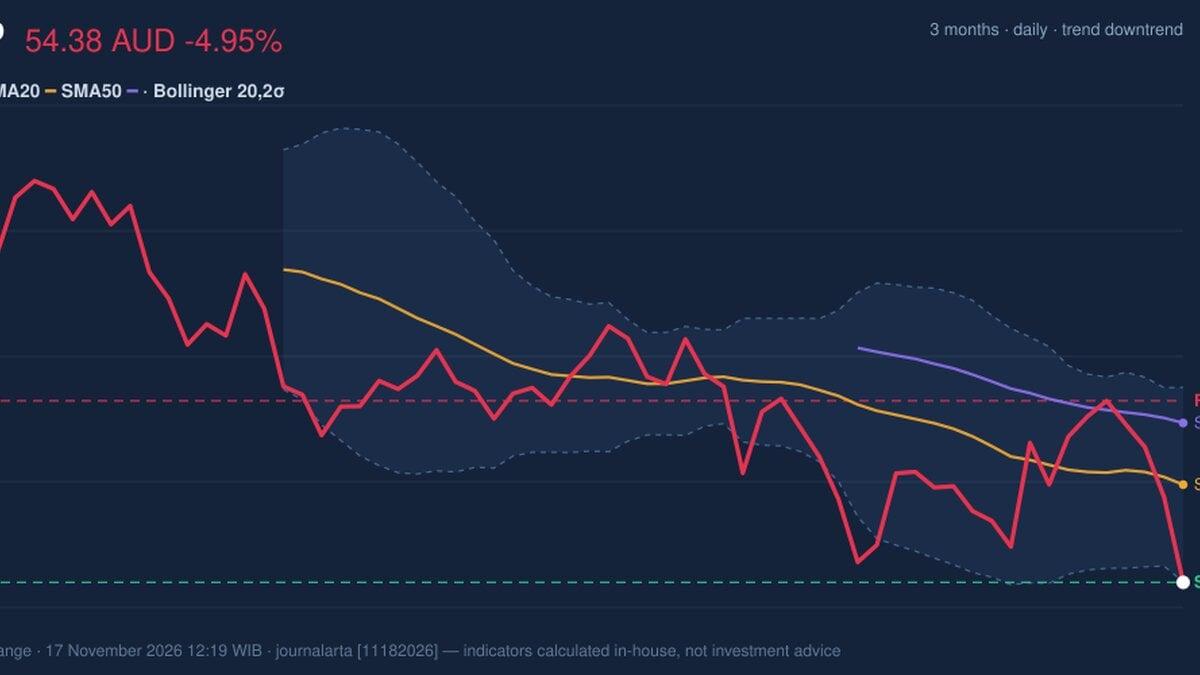
BHP Group fell 4.95% to A$54.38 on the ASX on Tuesday, November 17, 2026, putting the miner at the bottom of its three-month trading range as selling accelerated on unusually high volume. The move matters because it combines a price below key moving averages with bearish momentum signals and falling on-balance volume (OBV), which tracks whether trading activity is flowing more into buying or selling.
Why BHP is in focus today
- One-day move of 0.00%, about 0.0× its average daily range (ATR)
- Volume at 0.0× the 20-day average
Selected automatically from 9 ASX (Australia) stocks by a technical-signal score with daily weighted randomisation — not a recommendation.
Trend & Price Action
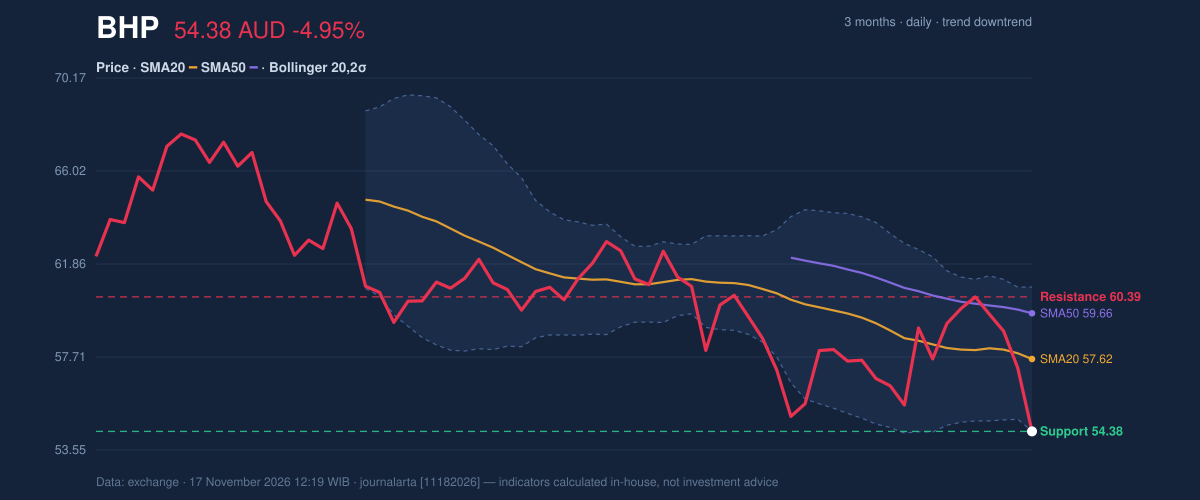
BHP has dropped 9.17% over five days and 8.61% over one month. Its price is below the 20-day average of A$57.62 and the 50-day average of A$59.66; the 20-day average itself fell 0.72% over five days. There has been no new moving-average crossover, but the broader structure remains a downtrend, with the shorter average below the longer one. That alignment points to sustained weakness rather than a single-day break.
The shares closed at the three-month low of A$54.38, down from the period high of A$68.77. The close also sits at the lower Bollinger Band, A$54.40, with %B at 0%. Bollinger Bands compare price with a recent average and its usual range; a touch at the lower band shows pressure at the bottom of that range, but does not by itself establish that a rebound is due. The band width of 11.2% is described as normal, not unusually compressed or expanded.
The price structure is bearish, but the lower-band test makes the immediate level important: a break would deepen the range deterioration, while a hold could allow a pause.
Oscillators & Momentum
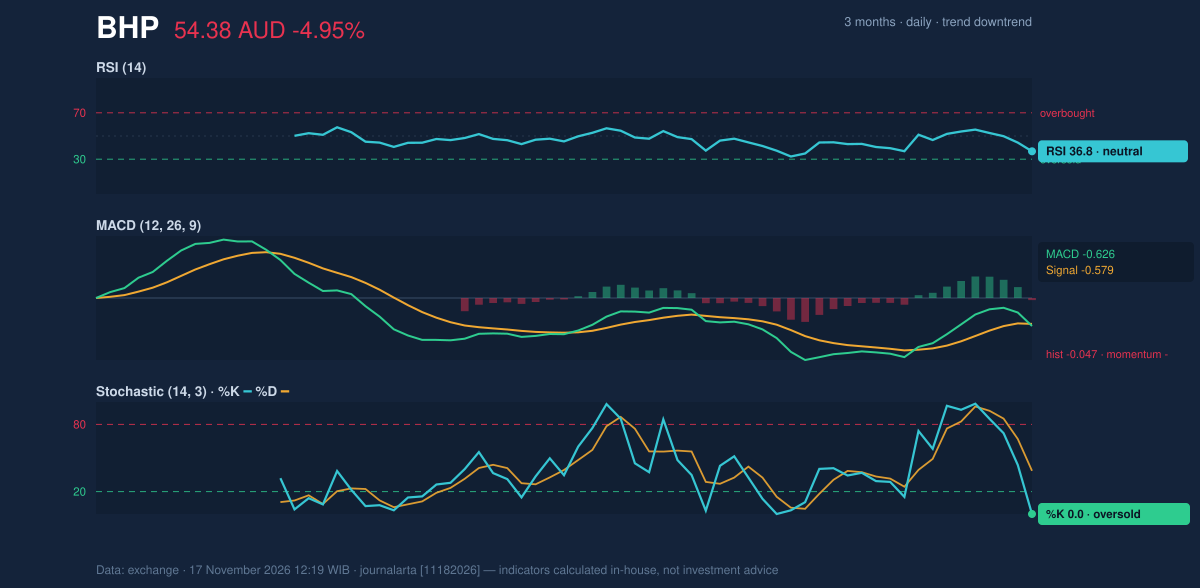
The momentum readings are weak, though not all point to the same timing. The MACD is negative at -0.626, with its histogram at -0.047, indicating downside momentum; the histogram has just turned negative. The Stochastic is oversold, with %K at 0.0 against %D at 38.6, a condition that can occur when selling has been persistent. Oversold does not mean the decline has ended. Meanwhile, RSI is 36.8, in the dataset’s neutral classification, rather than an oversold reading.
This mix suggests sellers have the trend advantage, while the Stochastic warns that the fall has become stretched in the short term. A sustained recovery would need more than an oversold reading: price would have to regain levels above its moving averages, and momentum would need to improve.
Volatility, Volume & Key Levels
Trading volume reached 14,350,497 shares, or 1.7 times its 20-day average of 8,323,602. That unusually heavy participation lends weight to the sell-off. OBV is also falling, reinforcing the interpretation that volume is accompanying distribution rather than accumulation. Average true range (ATR), a measure of typical price movement, is A$1.68, or 3.1% of the share price—moderate volatility, but enough to make moves around nearby levels meaningful.
Support is A$54.38 and resistance is A$60.39. The support is also the three-month low and the lower edge of the stated 20-day range; losing it would mark a further breakdown. A move back above support would not, on its own, reverse the trend: the share price remains below its A$57.62 20-day average and A$59.66 50-day average. The data’s selection-signal line conflicts with the observed session move and volume, so the analysis relies on the explicitly reported price, change and volume figures.
Technical Verdict: SELL
SELL is the JournalArta Research technical call. The main reasons are the downtrend and price below both moving averages, the negative MACD histogram, and falling OBV alongside a 1.7-times-average volume surge. The verdict is invalidated if the price rises above the specified A$57.23 stop-loss level.
- Entry range: A$54.38–A$55.63
- Exit targets: A$50.11 (target one) and A$45.83 (target two)
- Stop-loss protection: A$57.23
In plain English, the technical signals currently show stronger evidence of continued selling than of a confirmed recovery.
“The latest session’s unusually high volume is the clearest sign that the decline is drawing broad market participation.”
Summary Data BHP
| Last price | 54.38 AUD |
| Change 1 day / 5 days / 1 month | -4.95% / -9.17% / -8.61% |
| Trend / MA-cross | downtrend / none |
| SMA20 / SMA50 | 57.62 / 59.66 |
| RSI (14) / Stochastic %K | 36.8 / 0.0 |
| Bollinger %B / ATR | 0% / 1.68 |
| Support / Resistance 20 days | 54.38 / 60.39 |
| Data as of | 17 November 2026 12:19 WIB |
| JournalArta research verdict (score) | Sell (-89) |
| Sell zone | 54.38 – 55.63 |
| Target 1 / 2 | 50.11 / 45.83 |
| Stop loss | 57.23 |
| Reward/risk | 1.5 / 3.0 |
Today's full Buy and Sell list for Australian stocks (ASX) →
Disclaimer: This technical analysis is generated automatically from exchange data and indicators calculated by JournalArta, for information and education only. The verdict and the entry, target and stop-loss levels are not investment advice or a solicitation to buy or sell any security. Investment decisions and their risks rest solely with the reader.
Track BHP share price daily: live levels, support/resistance and our full BHP analysis history.
 Take the quizWhat Kind of Holiday Spender Are You? Take the Black Friday QuizStart →
- 1U.S. Emergency Alert Test Nov. 17 Is Not a Power Outage

- 2DUP Chairman Lord Morrow Loses Wife and Daughter Within Hours in NI

- 3Women With Autoimmune Diseases Wait About 4 Years for Diagnosis, Study Finds

- 4NASA’s Curiosity Rover Burst Open a Rock and Found Pure Sulfur

- 5Stock Market Today: Dow Futures Slip as Nasdaq Futures Climb Before Earnings

 Lifestyle7 Signs Your Social Battery Is Running Low (and Why You Keep Cancelling Plans)
 Lifestyle · Food & HealthThanksgiving Food Safety: How Long Leftovers Last and the Safe Turkey Temperature
 Lifestyle7 Quiet Habits of Emotionally Intelligent People, According to Psychologists
 LifestylePeople Who Don’t Like Celebrating Their Birthday Often Share These 7 Traits