Shell Stock Technicals Today: Drops 1.25%, Testing Key Resistance
On Agustus 25, 2026: price 3,397.00 GBp, trend uptrend, RSI 61.3, support 3,234.50, resistance 3,440.00. technical analysis of shell stock.

Shell plc traded lower on the London Stock Exchange on 21 August 2026, with the shares at 3,397.00 GBp, down 1.25% on the day, even as the broader technical picture still points to an upward trend. The move matters because it leaves the stock just below the session’s prior close of 3,440.00 and close to the upper half of its recent trading range, suggesting the pullback is more of a pause than a trend break for now.
Trend & Price Action
The shares remain in an uptrend, helped by the fact that price is still above the SMA20 at 3,335.48 and well above the SMA50 at 3,168.15. That positioning tells readers the market is still paying a premium for Shell’s recent strength, and the gap between the two moving averages shows the medium-term trend has not flattened out. The lack of a new MA-cross also matters: there is no fresh signal of a trend reversal, so the chart is still behaving like a rising market that has simply paused near resistance.
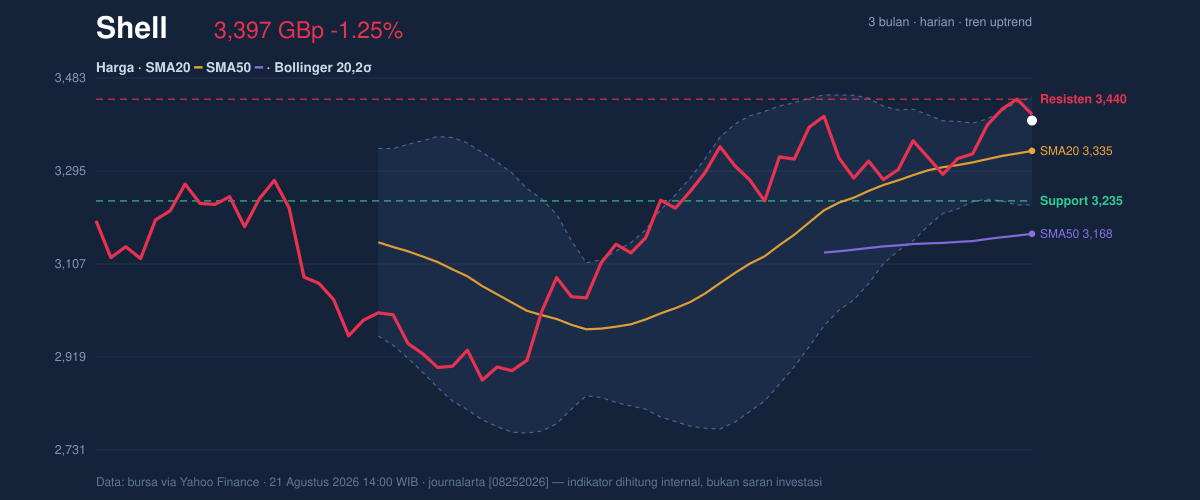
As shown in the chart, the stock is trading at about 79% of its 20-hour range, with support at 3,234.50 and resistance at 3,440.00. That placement is important because it means Shell is not languishing near the floor of the range; instead, it is still close enough to the ceiling that traders will be watching whether it can absorb selling pressure and retest the top band. The broader three-month range, from 2,559.50 to 3,758.50, shows there is still room above and below, but the current structure is clearly biased toward the higher end of that corridor.
Oscillators & Momentum
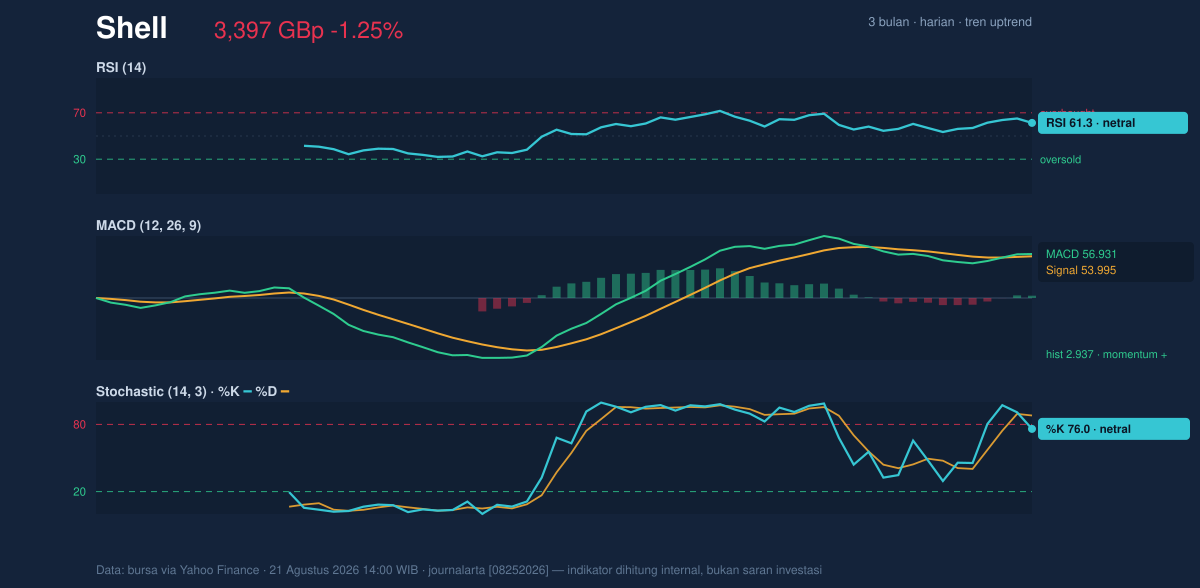
The momentum picture is constructive, but not euphoric. RSI at 61.3 is neutral rather than overbought, which means the stock has room to extend without immediately running into the kind of stretched condition that often precedes a pullback. Stochastic %K at 76.0 and %D at 87.9 lean elevated, signalling the recent rise has been strong enough to push the short-term oscillator into the upper zone, but not yet into a decisive reversal setup on its own. In plain terms, momentum is positive, though the stock is no longer early in its move.
The strongest confirmation comes from MACD at 56.931, sitting above its signal line at 53.995, with a positive histogram of 2.937. That combination means the trend’s internal force is still pointing upward: the faster line is ahead of the slower one, and the positive histogram says that gap is still working in the stock’s favour. Combined with the rising SMA20, this is a cleaner message than RSI alone, because MACD is showing that the uptrend still has active participation behind it.
Volatility & Volume
The Bollinger setup is quietly important here. The band width is only 6.5%, described in the data as a squeeze, which means volatility has compressed and the share price may be preparing for a larger directional move. When a stock sits near the upper half of a narrowing band, the market is often waiting for a catalyst to decide whether price pushes through resistance or slips back toward the middle line. In Shell’s case, the close to the upper band at 3,444.24 suggests buyers are still pressing the upper edge of the range, but they have not yet forced a clean escape.
Volume adds a useful layer of confirmation. The latest turnover of 12,439,271 is about 1.4× the 20-hour average of 8,775,161, and OBV is rising. That matters because price gains are more meaningful when they are backed by participation rather than drifting on thin trading. Rising OBV implies that accumulation has been stronger than distribution over the recent period, so the stock’s upward bias is not just a low-volume illusion.
ATR at 59.77, or 1.8% of price, indicates moderate volatility. That is a practical signal: Shell is not in a wild, news-driven swing regime, but it is active enough that a break from the current squeeze could travel with some speed. In other words, the chart is compressed, yet not dormant.
Key Levels & Scenarios
The immediate decision point is the 3,440.00 resistance. A sustained move above that level would strengthen the case that the squeeze is resolving to the upside, especially if volume stays above average and MACD remains positive. On the downside, 3,335.48, the SMA20 and Bollinger middle band, is the first line that tells traders whether the recent advance is still intact. If price loses that area, the market would be signalling that the current rebound has lost momentum and is reverting toward the lower half of the band structure.
The more important protective level is 3,234.50 support. A break below that point would weaken the current trend structure because it would push Shell back under the recent range floor and toward the lower Bollinger band at 3,226.71. That would not automatically mean a full trend reversal, but it would be a clear warning that the market is no longer respecting the higher lows that have supported the advance.
Technical Verdict: HOLD (wait & see)
HOLD (wait & see)
- MACD is positive, with the line above signal and a positive histogram, which supports the broader uptrend.
- Price is above SMA20 and SMA50, showing the trend structure is still intact.
- Bollinger bands are squeezing, so the next move could be meaningful, but direction is not yet confirmed by a breakout.
Invalidation: this verdict is invalidated if price falls below 3,234.50, because that would damage the current range structure and weaken the uptrend’s near-term support.
- Ideal entry range: 3,335.48 to 3,234.50
- Exit target: 3,440.00
- Stop loss protection: below 3,226.71
For non-traders, this means Shell’s chart still looks healthy, but the market has not yet proved it can clear the next ceiling.
“I’d want to see whether 3,440.00 gives way — because that’s where the stock has to prove this is more than just a pause.”
Summary Data Shell
| Last price | 3,397.00 GBp |
| Change 1 day / 5 days / 1 month | -1.25% / 2.32% / 2.77% |
| Trend / MA-cross | uptrend / none |
| SMA20 / SMA50 | 3,335.48 / 3,168.15 |
| RSI (14) / Stochastic %K | 61.3 / 76.0 |
| Bollinger %B / ATR | 78% / 59.77 |
| Support / Resistance 20 days | 3,234.50 / 3,440.00 |
| Data as of | 21 Agustus 2026 14:00 WIB |
