Momentum Gains, AstraZeneca Stock Gains 0.18% Today
On Agustus 25, 2026: price 12,110.00 GBp, trend sideways, RSI 49.5, support 11,460.00, resistance 13,134.00. technical analysis of astrazeneca stock.
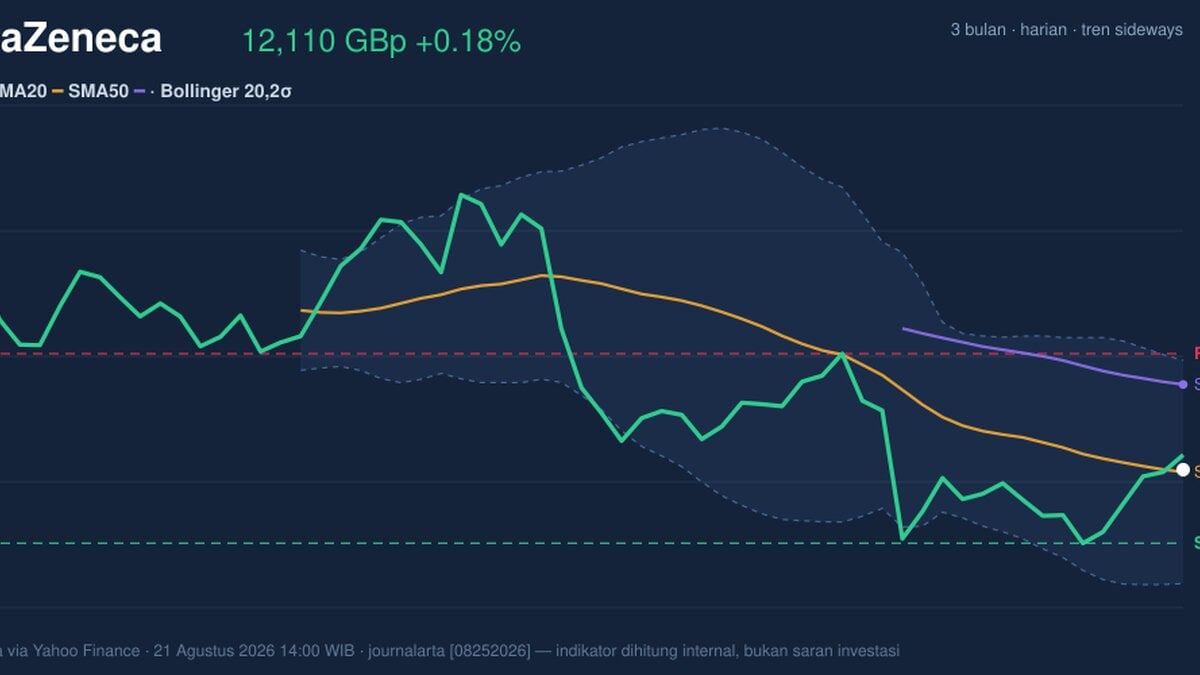
According to Yahoo Finance data at 14:00 WIB on 21 August 2026, AstraZeneca’s LSE-listed shares were last at 12,110.00 GBp, up 0.18% on the day and 5.67% over five days, even though the stock remains 4.42% lower over one month. That mix matters: the tape is not showing a clean breakout, but it is also not showing distribution. Instead, the shares are trying to stabilise just above the short-term average, while the longer trend still points to a market that has not yet fully repaired the damage from the prior slide.
Trend & Price Action
The most important signal on the chart is that price is above the SMA20 at 12,089.20, which tells readers the stock has at least reclaimed its nearest short-term trend line. But the broader structure is still capped by the SMA50 at 12,862.60, and that gap is large enough to show the medium-term trend has not turned decisively positive. In plain terms, AstraZeneca is trading in the space between short-term recovery and medium-term caution.
The trend label is sideways, and the SMA20 slope of -1.30% over five days explains why. A sideways market with a mildly falling short average usually means buyers are present, but not yet forceful enough to tilt the trend upward. The lack of a new MA-cross reinforces that reading: there is no fresh moving-average signal to suggest a new phase has started. As shown in the chart, the price is sitting near the middle of its Bollinger structure, which is consistent with consolidation rather than trend acceleration.
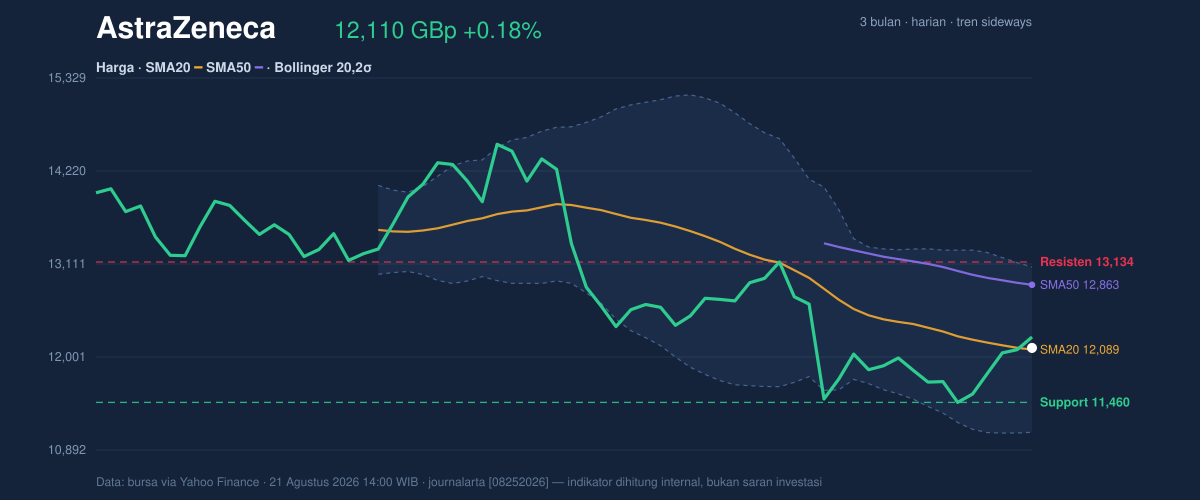
Relative location within the recent range is also telling. The stock sits at 39% of its 20-hour range, which means it is closer to support than resistance, but not deep enough to be considered washed out. The 20-hour support at 11,460.00 remains the nearest line that buyers have defended, while 13,134.00 is the immediate ceiling. The 3-month range, from 9,892.00 to 15,126.00, shows there is still ample room on both sides, but the current position does not yet imply a decisive trend regime.
Oscillators & Momentum
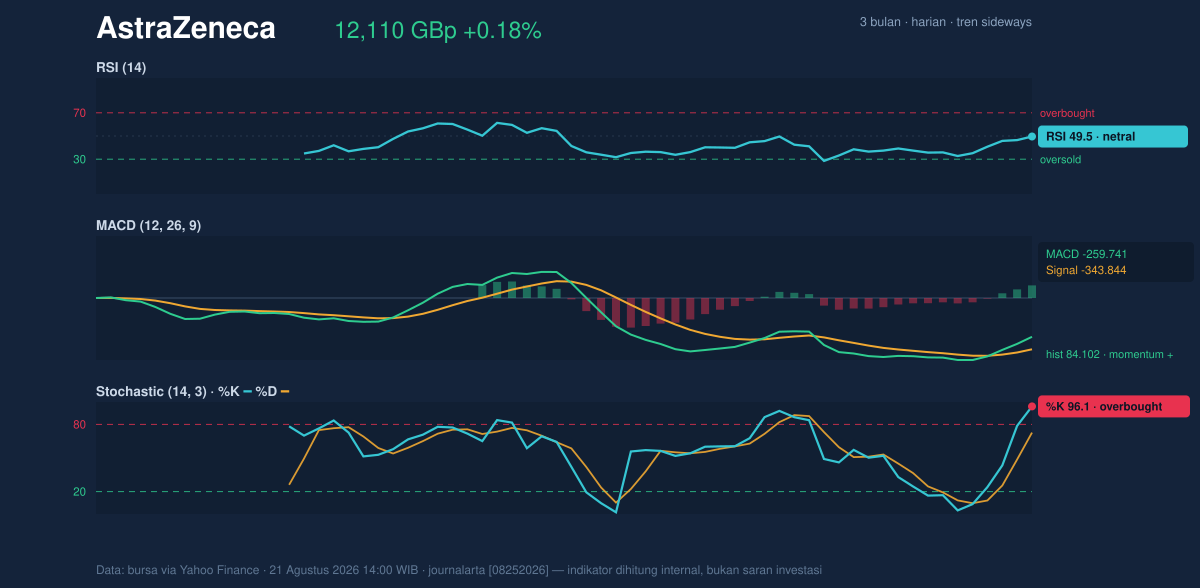
Momentum is mixed, and that mixture is what makes the chart interesting. The RSI at 49.5 is essentially neutral, which means the stock is neither stretched nor deeply oversold. That is a useful signal because it suggests the recent bounce is not yet exhausted on an RSI basis. At the same time, the Stochastic %K at 96.1 versus %D at 72.7 is firmly overbought, signalling that the short-term rebound may be running hot relative to the recent price path. In practical terms, the oscillator is warning that the latest lift has moved faster than the broader trend has improved.
The MACD at -259.741, with the signal line at -343.844 and a positive histogram of 84.102, is the most constructive part of the momentum picture. A negative MACD still means the longer trend has not fully flipped bullish, but the positive histogram shows the gap is narrowing and downside momentum is fading. That is a classic early-repair signal: not a confirmation of a full uptrend, but evidence that selling pressure has weakened enough for price to stabilise. The fact that MACD is improving while Stochastic is overbought suggests the stock may be in a pause after a rebound, rather than in a fresh impulsive leg higher.
Volatility & Volume
Volatility is not flashing stress. The Bollinger Band width of 16.3% is normal, and %B at 51% places price almost exactly at the centre of the band structure. That usually indicates balance between buyers and sellers, with no strong expansion signal yet. In other words, the chart is not squeezed into an imminent explosion, nor is it stretched enough to imply a panic move. The ATR(14) of 300.51, equal to 2.5% of price, says daily swings remain moderate and manageable for a large-cap healthcare name.
Volume, however, is where conviction looks thin. Last volume was 2,344,334, versus a 20-session average of 4,530,912, or about 0.5x normal activity. That matters because price gains made on light turnover often carry less authority; they can reflect a lack of sellers rather than strong buying demand. The one constructive offset is that OBV is rising, which suggests the cumulative flow of volume has been improving even if the latest session was quiet. As shown in the chart, the pattern is more consistent with cautious accumulation than with broad conviction.
Key Levels & Scenarios
The nearest battleground is clear. 11,460.00 is the first support to watch, and a failure there would weaken the current stabilisation pattern. On the upside, 13,134.00 is the immediate resistance, and a move through it would be the first sign that the rebound is extending beyond a short-term bounce. The Bollinger framework adds context: 12,089.20 sits at the middle band, so price is effectively testing whether it can hold the centre of the current range before attempting the upper band at 13,074.92.
The message from the chart is conditional rather than decisive. If price can remain above the middle band and build volume, the recent improvement in MACD could start to matter more. If it slips back below support, the overbought Stochastic reading would look less like strength and more like an exhausted bounce.
Technical Verdict: HOLD (wait & see)
- Why: price is above the SMA20, MACD histogram is positive, and OBV is rising, which together suggest the stock is repairing rather than breaking down.
- Why: RSI is neutral at 49.5, so the move is not yet overextended on the broader momentum gauge.
- Why: Stochastic is overbought and volume is only 0.5x average, which limits confidence in the current bounce.
- Invalidation: verdict is invalidated if price falls below 11,460.00.
- Ideal Entry Range: 11,460.00 to 12,089.20
- Exit Target: 13,074.92 to 13,134.00
- Stop Loss protection: below 11,460.00
For non-traders, this means AstraZeneca’s share price is stabilising, but the chart still needs stronger proof before the rebound looks durable.
Support sits at 11,460.00.
Summary Data AstraZeneca
| Last price | 12,110.00 GBp |
| Change 1 day / 5 days / 1 month | 0.18% / 5.67% / -4.42% |
| Trend / MA-cross | sideways / none |
| SMA20 / SMA50 | 12,089.20 / 12,862.60 |
| RSI (14) / Stochastic %K | 49.5 / 96.1 |
| Bollinger %B / ATR | 51% / 300.51 |
| Support / Resistance 20 days | 11,460.00 / 13,134.00 |
| Data as of | 21 Agustus 2026 14:00 WIB |
Track AstraZeneca share price daily: live levels, support/resistance and our full AstraZeneca analysis history.