RSI Oversold, GS Stock Drops 0.52% on Thursday
On October 8, 2026: price 882.59 USD, trend downtrend, RSI 29.3, support 882.59, resistance 1,029.18. technical analysis of gs stock. RSI Oversold — full…
Why GS is in focus today
- Closed at a 20-day low (882.59)
- Trading near its 3-month low (868.52)
- RSI(14) at 29.3 — oversold zone
- Downtrend extending (5-day change -1.57%)
- Not covered by JournalArta in the last 14 days
Selected automatically from 30 NYSE (US) stocks by a technical-signal score with daily weighted randomisation — not a recommendation.
Trend & Price Action
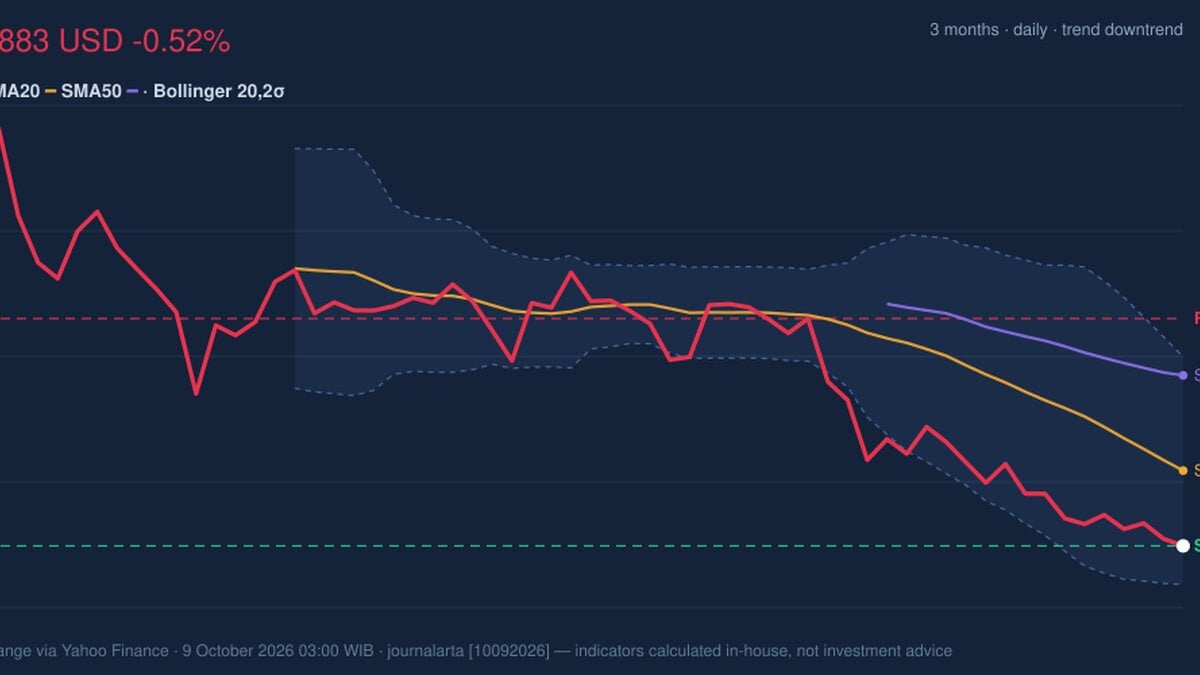
The bank’s stock has lost 1.57% over five trading days and 13.45% over one month. Its price is below both the 20-day simple moving average (SMA), at $931.11, and the 50-day SMA, at $992.52. A moving average smooths recent prices to show the direction of a trend; here, the gap between the share price and both averages signals sustained pressure rather than a one-day wobble. The 20-day average is also falling, down 3.62% over five days. No new moving-average crossover has formed, so there is no fresh technical signal that the trend has reversed. The shares are pressing against the bottom of their recent range. Goldman closed at the stated 20-day support of $882.59, while its three-month low is $868.52. The Bollinger lower band, another measure of a stock’s recent trading range, stands at $857.57. The price is near these lower markers, but proximity alone does not establish that selling has run its course.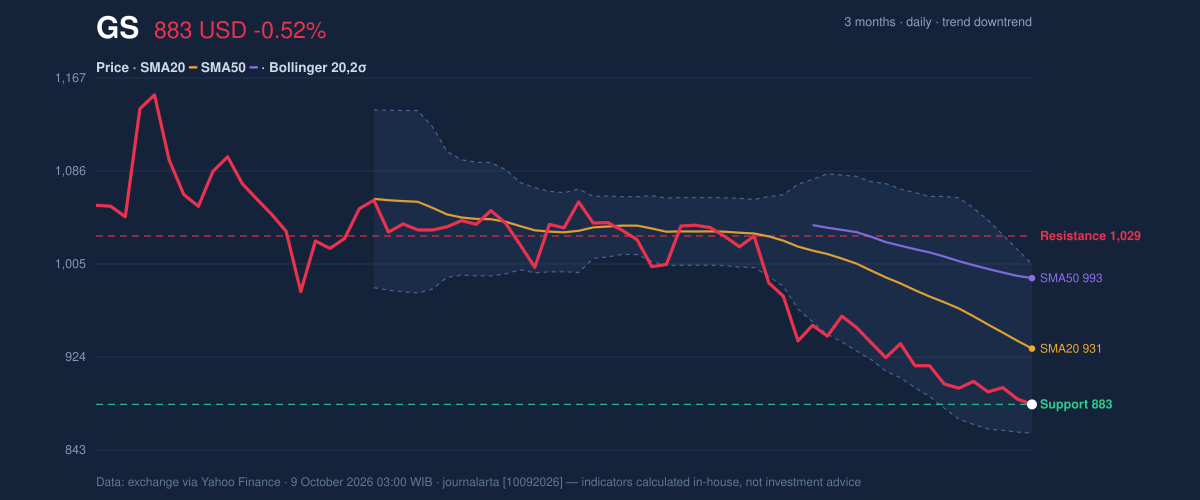
Oscillators & Momentum
The Relative Strength Index (RSI), which gauges the pace of recent gains and losses, is 29.3, in oversold territory. The Stochastic oscillator, which compares a recent close with the stock’s recent price range, is also oversold: %K is 14.2 and %D is 17.2. These readings indicate that selling has been intense. They can accompany a short-term bounce, but they do not tell investors when one will begin or whether it will last. The Moving Average Convergence Divergence indicator (MACD), a trend-and-momentum measure, remains negative at -32.727, below its -30.772 signal line. Its histogram is -1.955, consistent with negative momentum. That makes the oversold readings a counterpoint to the prevailing trend, not confirmation of a reversal.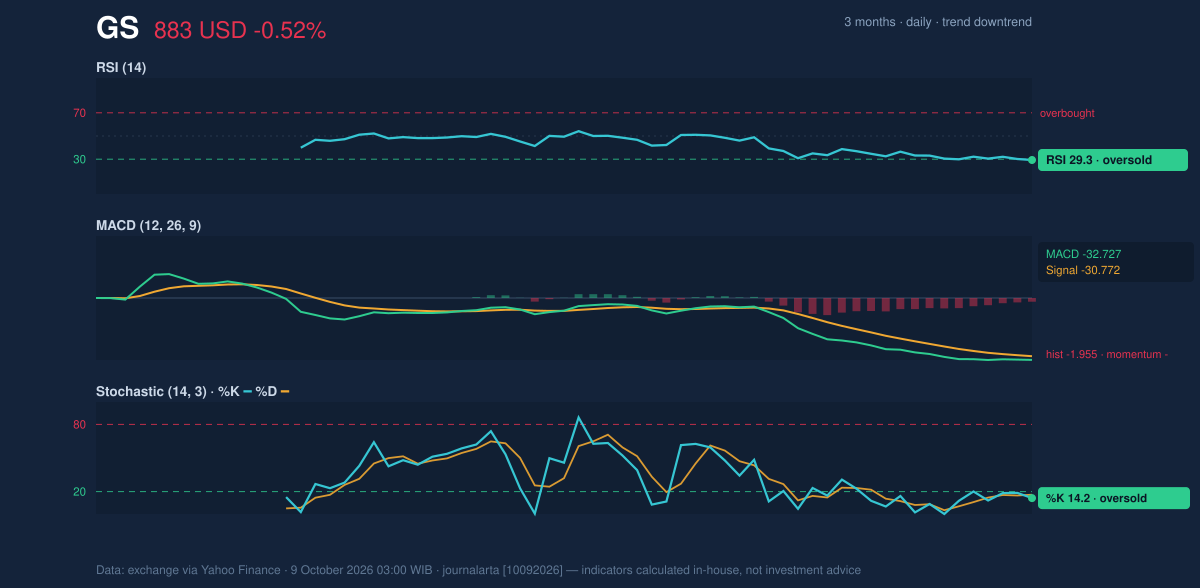
Volatility, Volume & Levels
Goldman’s Bollinger %B is 17%, placing the price near the lower part of the band; the band width is 15.8%, described by the data as normal rather than unusually compressed or expanded. Average True Range (ATR), a measure of typical price movement, is $19.61, or 2.2% of the share price, indicating moderate volatility. These measures frame the current move but do not point to a specific direction. Trading volume was 1,753,500 shares, about 0.8 times the 20-day average of 2,233,805, while on-balance volume (OBV), which tracks whether volume flows more heavily into rising or falling sessions, is declining. The lighter-than-average turnover means the latest drop came without elevated participation, but falling OBV still reflects weak accumulation. The immediate reference is support at $882.59, with the three-month low at $868.52 and the lower Bollinger band at $857.57 below it. A failure to hold those nearby levels would leave the shares testing lower reference points in sequence. On the upside, $931.11 is the 20-day SMA, followed by the 50-day SMA at $992.52; the stated 20-day resistance is $1,029.18. Reclaiming the moving averages would be needed to ease the evidence of a downtrend.Technical Verdict: HOLD
The technical picture supports a wait-and-see assessment: the downtrend and negative MACD remain intact, while oversold RSI and Stochastic readings argue against treating weakness as a one-way signal. The verdict would be invalidated if the price falls below $857.57, the lower Bollinger band in the supplied data.- Illustrative entry range: $857.57–$882.59, bounded by the lower Bollinger band and 20-day support.
- Illustrative exit target: $931.11, the 20-day SMA and nearest stated moving-average reference above the price.
- Illustrative stop-loss protection: Below $857.57, where a breach would weaken the current support-based scenario.
Summary Data GS
| Last price | 882.59 USD |
| Change 1 day / 5 days / 1 month | -0.52% / -1.57% / -13.45% |
| Trend / MA-cross | downtrend / none |
| SMA20 / SMA50 | 931.11 / 992.52 |
| RSI (14) / Stochastic %K | 29.3 / 14.2 |
| Bollinger %B / ATR | 17% / 19.61 |
| Support / Resistance 20 days | 882.59 / 1,029.18 |
| Data as of | 9 October 2026 03:00 WIB |
Disclaimer: This technical analysis is generated automatically from exchange data (via Yahoo Finance) and indicators calculated by JournalArta, for information and education only. The verdict and the entry, target and stop-loss levels are not investment advice or a solicitation to buy or sell any security. Investment decisions and their risks rest solely with the reader.
Track GS stock price daily: live levels, support/resistance and our full GS analysis history.