Death Cross Pressure, JNJ Stock Drops 0.76% on Thursday
On October 8, 2026: price 256.48 USD, trend downtrend, RSI 37.9, support 252.93, resistance 271.95. technical analysis of jnj stock. World space week 2026 —…
Why JNJ is in focus today
- Fresh death cross: SMA20 crossed below SMA50
- Not covered by JournalArta in the last 14 days
Selected automatically from 30 NYSE (US) stocks by a technical-signal score with daily weighted randomisation — not a recommendation.
Trend & Price Action
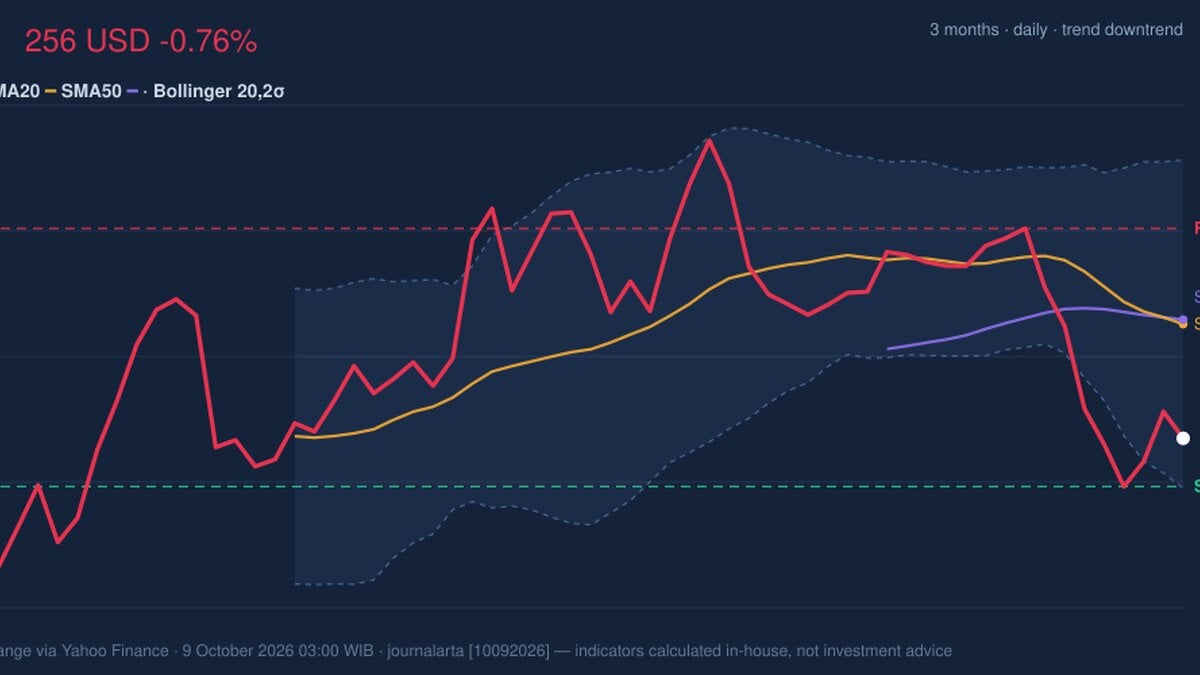
JNJ is down 0.84% over five trading days and 3.71% over one month. Its last price sits below both the 20-day simple moving average (SMA) at $264.90 and the 50-day SMA at $265.22. A death cross occurs when the shorter-term average moves below the longer-term one; here, it signals that recent weakness has overtaken the prior trend rather than merely producing a single-session dip. The 20-day average’s slope is also falling, declining 1.44% over five days. The shares are near the lower end of their recent trading range: 19% of the way from support to resistance within the $252.93–$271.95 band. They remain above the three-month low of $245.49, but that distance does not erase the immediate pressure. As shown in the chart, the price is below the moving averages and close to the lower Bollinger band, leaving support as the near-term test.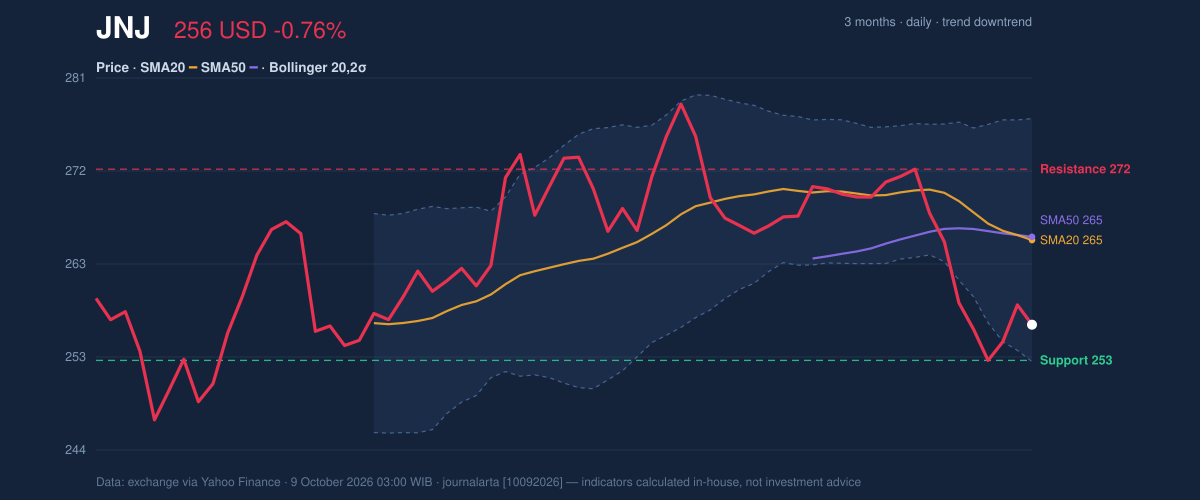
Momentum & Volatility
Momentum readings reinforce the weak trend, though they do not yet show an extreme washout. The RSI is 37.9, a neutral reading on the supplied scale, but close enough to the lower end to indicate that sellers have had the upper hand. The Stochastic %K at 22.1 and %D at 22.4 are also classified as neutral. These measures can help identify stretched conditions, but neither currently provides a clear reversal signal. The MACD is negative at -2.974, below its -1.435 signal line, with a negative histogram of -1.539. That alignment points to downside momentum: the shorter-term price trend remains weaker than the longer-term momentum baseline. As shown in the momentum chart, the oscillators are subdued while MACD remains below zero, a combination that argues against treating the low RSI reading alone as evidence that selling is exhausted.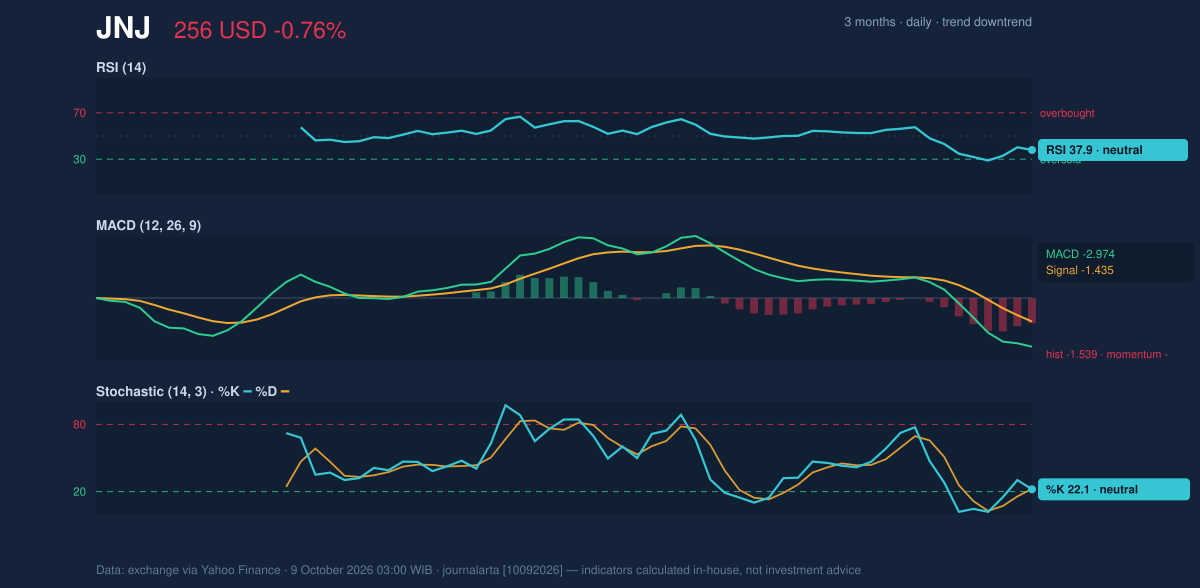
Volume & Key Levels
Trading volume was 6,172,800 shares, about 0.9 times its 20-trading-day average of 6,772,715. That is below-normal participation, while OBV—the running tally that compares volume on rising and falling sessions—is declining. The combination suggests selling pressure is present, but the latest drop did not arrive with unusually heavy turnover. It offers limited evidence of broad capitulation or a decisive shift in investor positioning. The first technical test is support at $252.93, close to the lower Bollinger band at $252.80. A sustained break below that zone would weaken the case that the three-month low of $245.49 can contain further downside. If support holds, a recovery would still face the moving-average cluster around $264.90–$265.22, then resistance at $271.95. A move through those levels would be needed to challenge the current downtrend; until then, rallies remain vulnerable to selling near overhead resistance.Technical Verdict: HOLD (wait & see)
The indicators lean bearish, but the share price is approaching a defined support area, while volume is below average and the momentum oscillators remain neutral rather than showing an extreme reading. That leaves insufficient confirmation for a directional technical verdict beyond waiting for the support test and trend signals to clarify. - Ideal entry range: $252.80–$256.48, the lower Bollinger area through the latest price; this is a technical reference range, not a recommendation. - Exit target (target price): $264.90–$271.95, spanning the 20-day average to the 20-trading-day resistance. - Stop-loss protection: $245.49, the three-month low. - Invalidation: This verdict is invalidated if the price breaks below $245.49. For non-traders, the chart says JNJ’s short-term trend is weak, but its nearby support has not yet been decisively broken.| Metric | Reading |
|---|---|
| Latest price | $256.48 |
| Daily change | -0.76% |
| SMA20 / SMA50 | $264.90 / $265.22 |
| RSI / Stochastic | 37.9 / 22.1 and 22.4 |
| MACD / signal | -2.974 / -1.435 |
| Support / resistance | $252.93 / $271.95 |
| Three-month high / low | $281.07 / $245.49 |
Summary Data JNJ
| Last price | 256.48 USD |
| Change 1 day / 5 days / 1 month | -0.76% / -0.84% / -3.71% |
| Trend / MA-cross | downtrend / death |
| SMA20 / SMA50 | 264.90 / 265.22 |
| RSI (14) / Stochastic %K | 37.9 / 22.1 |
| Bollinger %B / ATR | 15% / 5.08 |
| Support / Resistance 20 days | 252.93 / 271.95 |
| Data as of | 9 October 2026 03:00 WIB |
Disclaimer: This technical analysis is generated automatically from exchange data (via Yahoo Finance) and indicators calculated by JournalArta, for information and education only. The verdict and the entry, target and stop-loss levels are not investment advice or a solicitation to buy or sell any security. Investment decisions and their risks rest solely with the reader.
Track JNJ stock price daily: live levels, support/resistance and our full JNJ analysis history.