BA Stock Technicals: Drops 0.30% on Thursday, Momentum Gains
On October 8, 2026: price 187.75 USD, trend downtrend, RSI 35.8, support 184.39, resistance 210.45. technical analysis of ba stock. BA Stock Technicals — full…
Why BA is in focus today
- Downtrend extending (5-day change -2.36%)
- Not covered by JournalArta in the last 14 days
Selected automatically from 30 NYSE (US) stocks by a technical-signal score with daily weighted randomisation — not a recommendation.
Trend & Price Action
Boeing trades below both its 20-day simple moving average (SMA), at $196.19, and its 50-day SMA, at $210.37. A simple moving average smooths daily price changes to show the prevailing direction; when the share price sits beneath both measures, rallies have yet to overturn the broader weakness. The 20-day average is also falling, down 2.30% over five trading days. No new moving-average crossover has formed, so there is no fresh signal that the short-term trend has turned. The stock is at just 13% of its range between the $184.39 support and $210.45 resistance recorded over 20 trading days. Its three-month range runs from $184.01 to $241.09, putting the latest price close to the period low. That location can make support especially important: holding it may stabilize trading, while a break could leave the stock testing the lower edge of its recent range. As shown in the chart, Boeing’s price is below its falling 20-day average and near the lower Bollinger Band. Bollinger Bands plot a moving average with upper and lower boundaries that adjust to price volatility; they help show whether a stock is trading near an unusually high or low part of its recent range.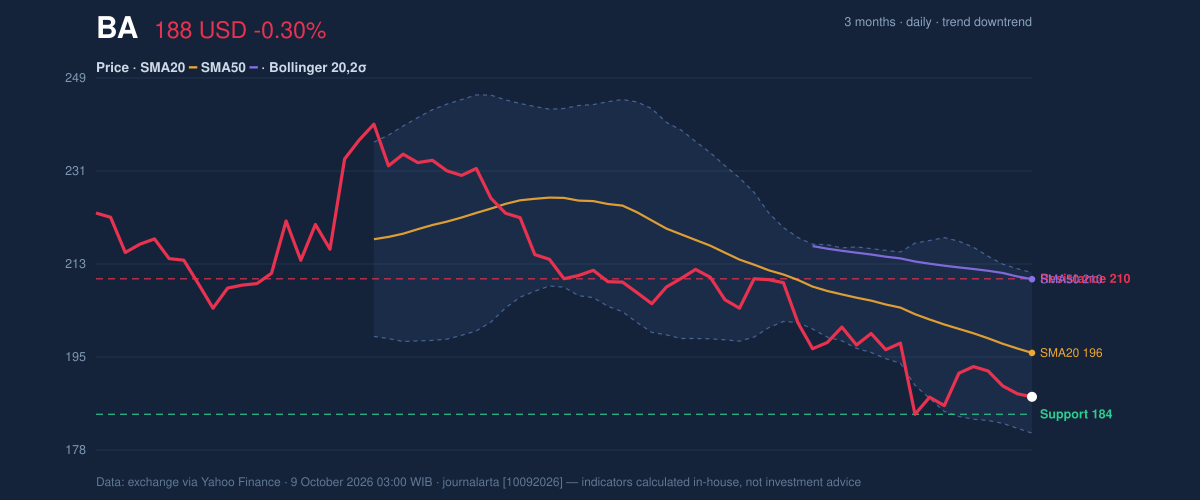
Oscillators & Momentum
The RSI is 35.8, a neutral reading, though it is closer to the level commonly associated with oversold conditions than with strong buying momentum. The Stochastic, a shorter-term measure of where the latest close sits within its recent range, is more emphatic: %K at 18.6 and %D at 23.0 indicate oversold conditions. That can signal that selling has become stretched, but it does not by itself show that buyers have taken control. The MACD offers a small counterpoint. Its reading is -5.894, just above its -5.917 signal line, and the histogram is positive at 0.022. MACD compares two moving averages to gauge the direction and strength of momentum. Here, the slightly positive histogram points to improving short-term momentum, but both MACD lines remain below zero. The improvement is therefore modest and has not yet displaced the broader downtrend.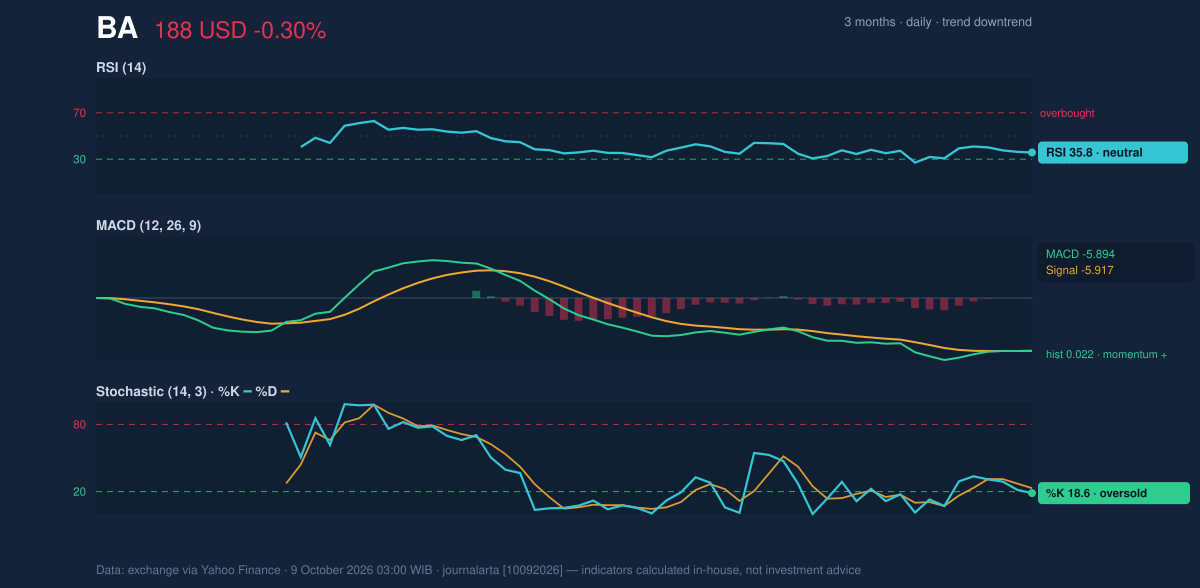
Volatility, Volume & Key Levels
Boeing’s Bollinger %B is 23%, placing the price in the lower portion of the band, but the 15.7% band width is described as normal rather than unusually tight or wide. The bands are not signaling a volatility squeeze or an exceptional expansion. Average True Range, which estimates typical daily movement, is $6.16, or 3.3% of the share price—consistent with moderate volatility, but enough to make moves around support consequential. Latest volume was 11,354,100 shares, about 1.2 times the 20-day average. Higher-than-usual activity gives the decline added weight, while falling On-Balance Volume (OBV)—a measure that tracks whether volume is accumulating on rising or falling sessions—suggests participation has not yet shifted decisively in buyers’ favor. The immediate level to watch is $184.39 support, close to the three-month low of $184.01. A sustained hold there, followed by a move back toward the $196.19 20-day average, would provide stronger evidence of stabilization. A break below $184.39 would weaken that case. Overhead, $210.45 resistance aligns closely with the 50-day average at $210.37, making that zone a more substantial test than a simple move above the short-term average.Technical Verdict: HOLD (wait & see)
The technical picture favors caution: the downtrend and falling OBV remain in place, while oversold Stochastic readings and a marginally positive MACD histogram hint at a possible short-term pause. The price remains below both moving averages, and the latest volume does not yet confirm a durable reversal. - Ideal Entry Range: $184.39–$196.19, bounded by 20-day support and the 20-day SMA; a hold at support and recovery toward the average would improve the technical setup. - Exit Target (Target Price): $210.37–$210.45, the 50-day SMA and 20-day resistance zone. - Stop Loss: Below $184.01, the three-month low; the verdict is invalidated if price breaks below $184.39 support. For non-traders, this means the indicators show early hints of a pause in the decline, but not enough confirmation that the trend has turned.Summary Data BA
| Last price | 187.75 USD |
| Change 1 day / 5 days / 1 month | -0.30% / -2.36% / -8.33% |
| Trend / MA-cross | downtrend / none |
| SMA20 / SMA50 | 196.19 / 210.37 |
| RSI (14) / Stochastic %K | 35.8 / 18.6 |
| Bollinger %B / ATR | 23% / 6.16 |
| Support / Resistance 20 days | 184.39 / 210.45 |
| Data as of | 9 October 2026 03:00 WIB |
Disclaimer: This technical analysis is generated automatically from exchange data (via Yahoo Finance) and indicators calculated by JournalArta, for information and education only. The verdict and the entry, target and stop-loss levels are not investment advice or a solicitation to buy or sell any security. Investment decisions and their risks rest solely with the reader.
Track BA stock price daily: live levels, support/resistance and our full BA analysis history.