KO Stock Gains 2.27%, Death Cross Pressure In Focus
On October 8, 2026: price 87.77 USD, trend sideways, RSI 52.7, support 85.65, resistance 89.35. technical analysis of ko stock. KO Stock Gains — full details…
Why KO is in focus today
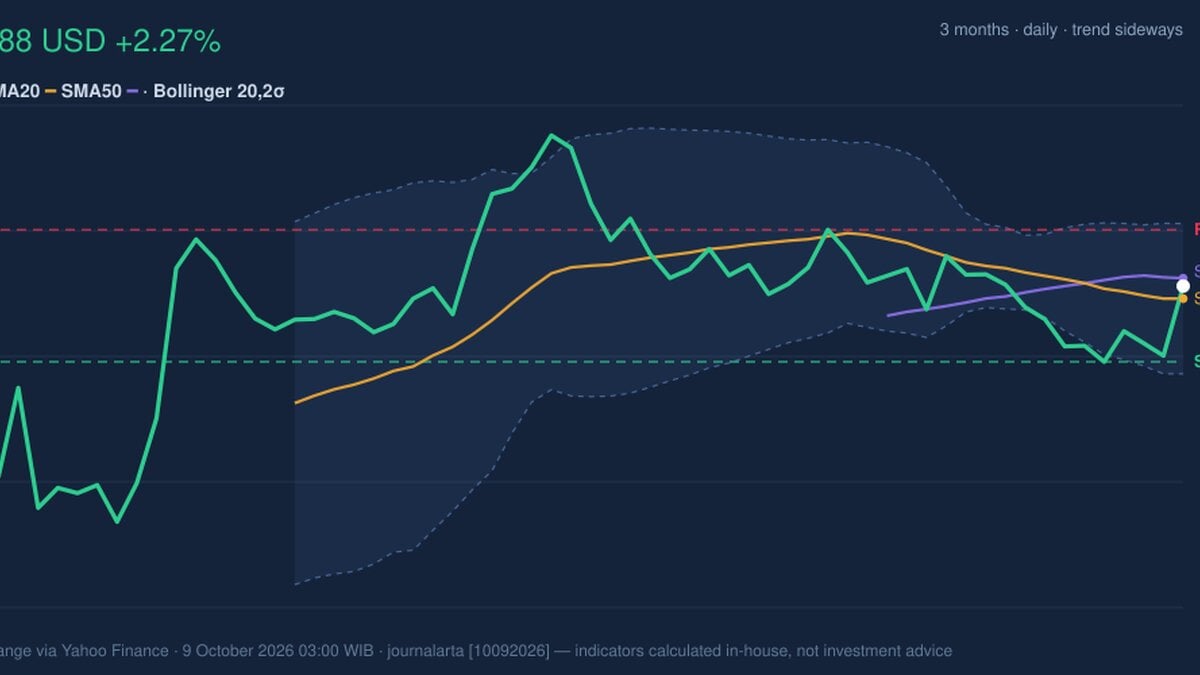
- One-day move of 2.27%, about 1.5× its average daily range (ATR)
- Fresh death cross: SMA20 crossed below SMA50
Selected automatically from 30 NYSE (US) stocks by a technical-signal score with daily weighted randomisation — not a recommendation.
Trend & Price Action
The share price finished above its 20-day simple moving average (SMA) of $87.42, but just below its 50-day SMA of $87.99. That puts KO between two near-term reference points: buyers have reclaimed the shorter average, while the longer one remains overhead. The death cross—when the shorter moving average falls below the longer one—signals weakening trend structure, though it is not proof that declines must continue. The wider pattern remains sideways. The 20-day average has a downward slope of 0.50% over five days, and KO’s one-month change is nearly flat at -0.07%, despite gains of 1.94% over five days and 2.27% in one day. The latest advance has therefore improved the short-term picture without yet overturning the broader lack of direction. As shown in the chart, the price sits 57% of the way through its recent 20-day range, between support at $85.65 and resistance at $89.35.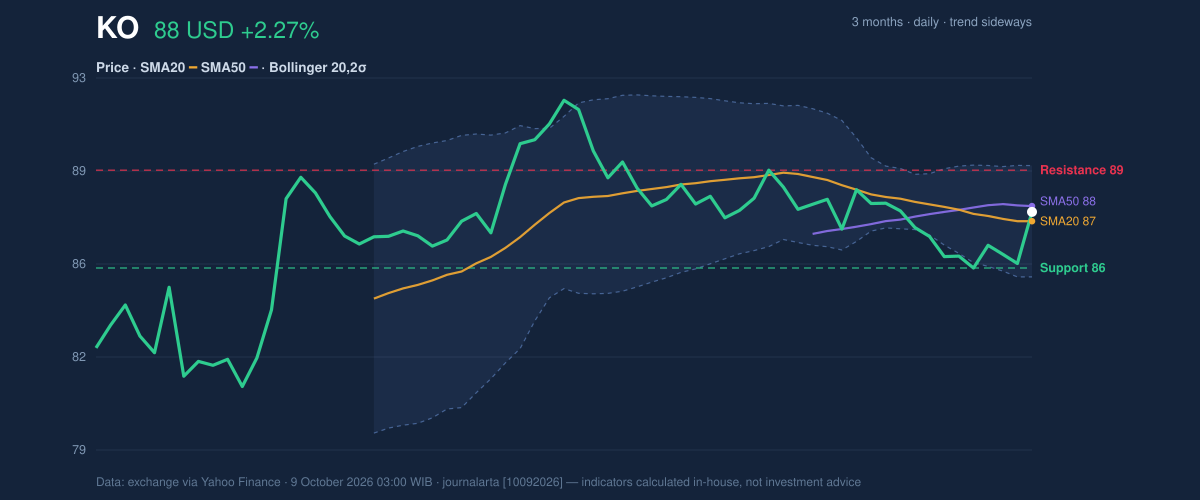
Oscillators & Momentum
The RSI, a gauge of the speed and persistence of recent price moves, stands at 52.7, a neutral reading. Stochastic %K at 62.4 and %D at 34.4 also remain neutral. These measures do not show an extreme condition that would, by itself, signal an imminent reversal. The gap between the two Stochastic lines may indicate improving short-term momentum, but it needs confirmation from price action. That confirmation is not yet present in the MACD. Its reading of -0.431 is below its signal line at -0.352, leaving a negative histogram of -0.079. In plain terms, the trend-following measure still shows downside momentum, even after the latest daily gain. This divergence between a stronger session and weaker trend indicators argues for caution in interpreting the rise as a sustained turn.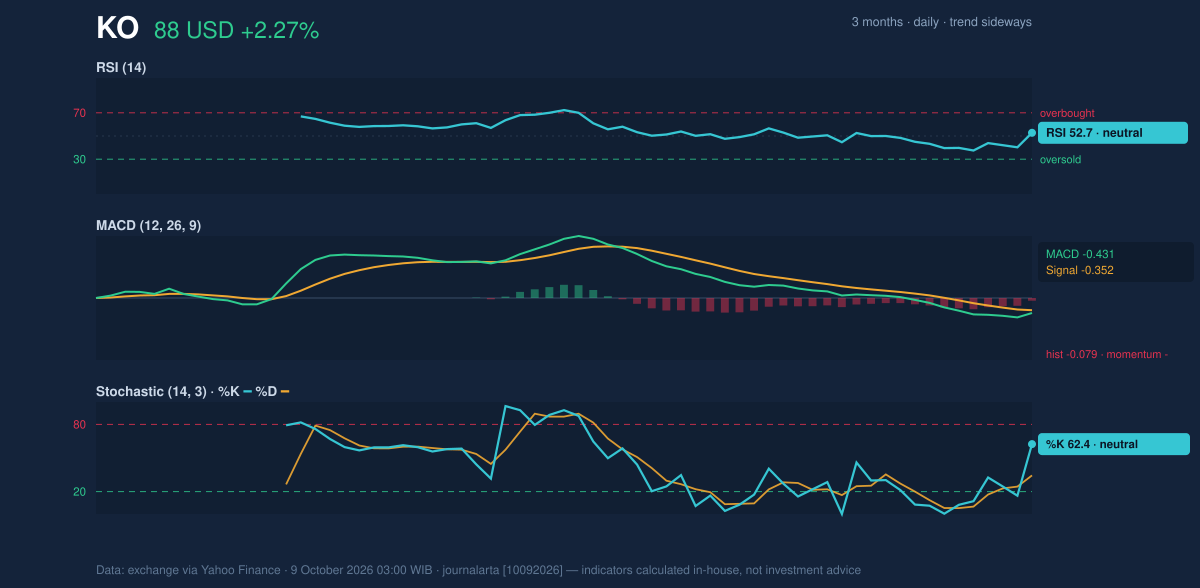
Volatility, Volume & Key Levels
Bollinger Bands—an envelope around the moving average that widens or narrows with price volatility—are contracting. Their 4.8% width is described as a squeeze, which can precede a larger move but does not predict its direction. KO’s price is at 58% of the band, between the $85.31 lower band and $89.52 upper band, rather than pressing either boundary. The average true range (ATR), a measure of typical daily movement, is $1.29, or 1.5% of the share price: volatility is currently low. Trading volume was 15,885,600 shares, close to the 20-day average of 16,089,685. That is roughly normal participation, not a surge that strongly confirms the advance. On-balance volume (OBV), which tracks whether volume is associated with net buying or selling, is falling. That weakens the case that the price rise reflects broad accumulation. A move above $89.35 would clear the stated 20-day resistance and bring the upper Bollinger Band at $89.52 into view. Failure to hold the $85.65 support would put the lower band at $85.31 in focus; the three-month low is $80.83. Those levels frame the technical risk without resolving the mixed signals.Technical Verdict: HOLD (wait & see)
The indicators support a neutral stance: KO is above its SMA20 but below its SMA50, MACD momentum remains negative, and falling OBV does not confirm the rally. The narrowing Bollinger Bands add the possibility of a sharper move, but not a reliable directional cue. This verdict is invalidated if the price falls below $85.65, the stated 20-day support.- Ideal entry range: $85.65–$87.42, anchored to support and the SMA20.
- Exit target: $89.35–$89.52, set by resistance and the upper Bollinger Band.
- Stop-loss protection: Below $85.31, the lower Bollinger Band.
| Data point | Reading |
|---|---|
| Last price | $87.77 |
| Daily change | +2.27% |
| SMA20 / SMA50 | $87.42 / $87.99 |
| RSI(14) | 52.7 |
| MACD / signal / histogram | -0.431 / -0.352 / -0.079 |
| Support / resistance (20-day) | $85.65 / $89.35 |
| Source | Exchange data via Yahoo Finance, as of Oct. 9, 2026, 03:00 WIB |
Summary Data KO
| Last price | 87.77 USD |
| Change 1 day / 5 days / 1 month | 2.27% / 1.94% / -0.07% |
| Trend / MA-cross | sideways / death |
| SMA20 / SMA50 | 87.42 / 87.99 |
| RSI (14) / Stochastic %K | 52.7 / 62.4 |
| Bollinger %B / ATR | 58% / 1.29 |
| Support / Resistance 20 days | 85.65 / 89.35 |
| Data as of | 9 October 2026 03:00 WIB |
Disclaimer: This technical analysis is generated automatically from exchange data (via Yahoo Finance) and indicators calculated by JournalArta, for information and education only. The verdict and the entry, target and stop-loss levels are not investment advice or a solicitation to buy or sell any security. Investment decisions and their risks rest solely with the reader.
Track KO stock price daily: live levels, support/resistance and our full KO analysis history.