PG Stock Gains 1.87%, Testing Key Resistance In Focus
On October 8, 2026: price 150.59 USD, trend uptrend, RSI 60.9, support 143.95, resistance 150.59. technical analysis of pg stock. PG Stock Gains — full details…
Why PG is in focus today
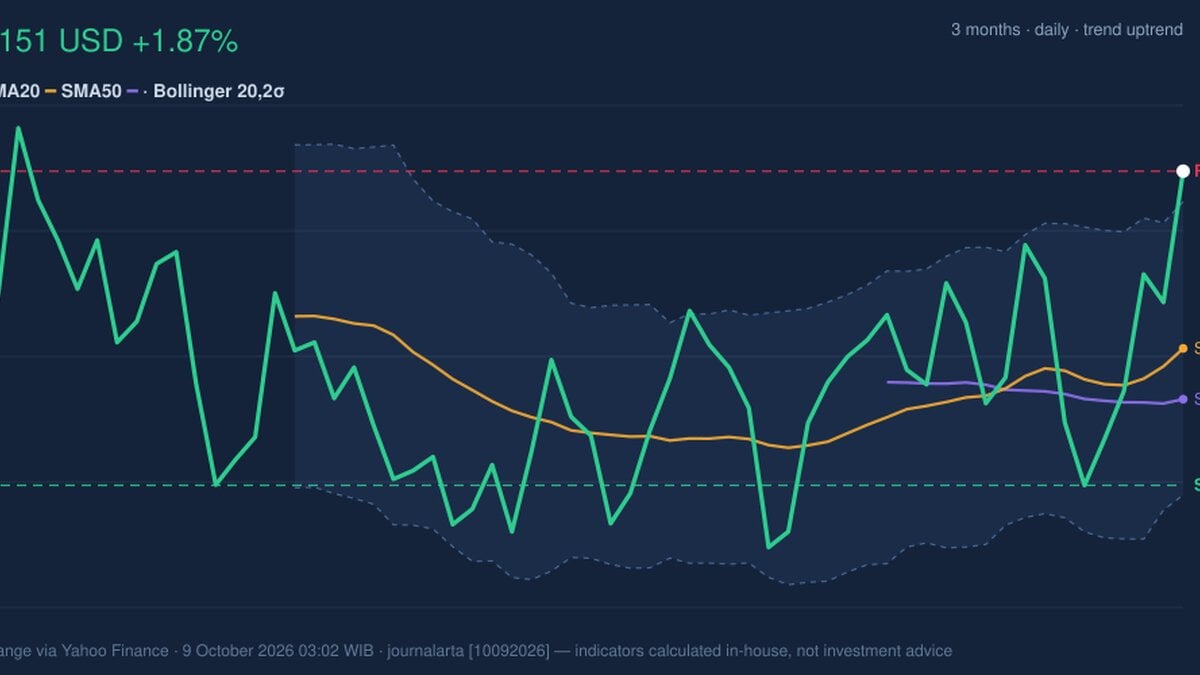
- Closed at a 20-day high (150.59)
- Breaking out of a Bollinger squeeze (band width 4.2%)
- Uptrend confirmed (5-day change 4.61%)
Selected automatically from 30 NYSE (US) stocks by a technical-signal score with daily weighted randomisation — not a recommendation.
Trend & Price Action
PG’s price is above both its 20-day simple moving average (SMA) of $146.84 and its 50-day SMA of $145.77. A simple moving average smooths daily price changes to show the direction of a trend; here, the shorter average is above the longer one, while the 20-day average is rising at 0.45% over five days. There has been no new moving-average crossover, so the signal is not a fresh technical turning point. Instead, the price action and rising short-term average suggest an existing uptrend has strengthened. The close at $150.59 also marks the 20-day resistance level and the top of the recent range. PG has moved beyond the upper Bollinger Band at $149.94. Bollinger Bands track price relative to a moving average, widening or narrowing as volatility changes; a close above the upper band can signal forceful buying, though it does not by itself establish that the move will continue. The band width is only 4.2%, indicating a squeeze—a period of relatively compressed price movement that can precede a larger move in either direction.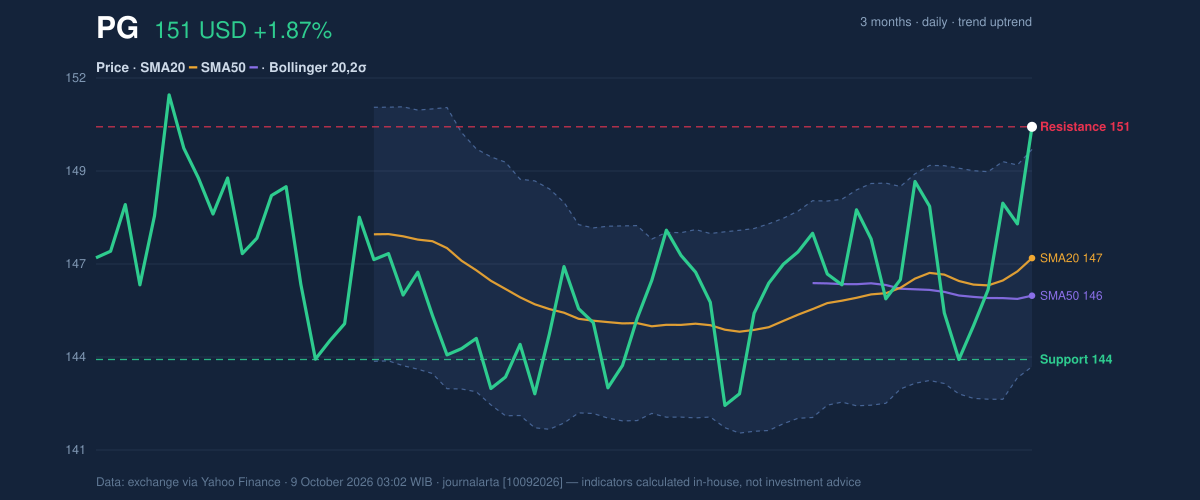
Oscillators & Momentum
Momentum indicators broadly confirm the upward move, but they show different degrees of heat. The RSI is 60.9, a neutral reading, consistent with positive momentum that has not yet reached the conventional overbought zone. The Stochastic reading is overbought at %K 97.7 and %D 82.6. This oscillator compares a closing price with its recent range; readings near the top suggest the shares have advanced quickly and may be vulnerable to a pause or pullback. The MACD is positive at 0.596, above its 0.306 signal line, with a positive histogram of 0.290. MACD compares moving averages to assess momentum, so its configuration supports the trend rather than contradicting it. The key tension is between that positive momentum and the Stochastic’s stretched reading: buyers remain in control, but a short-term cooling would not, on its own, negate the broader price structure.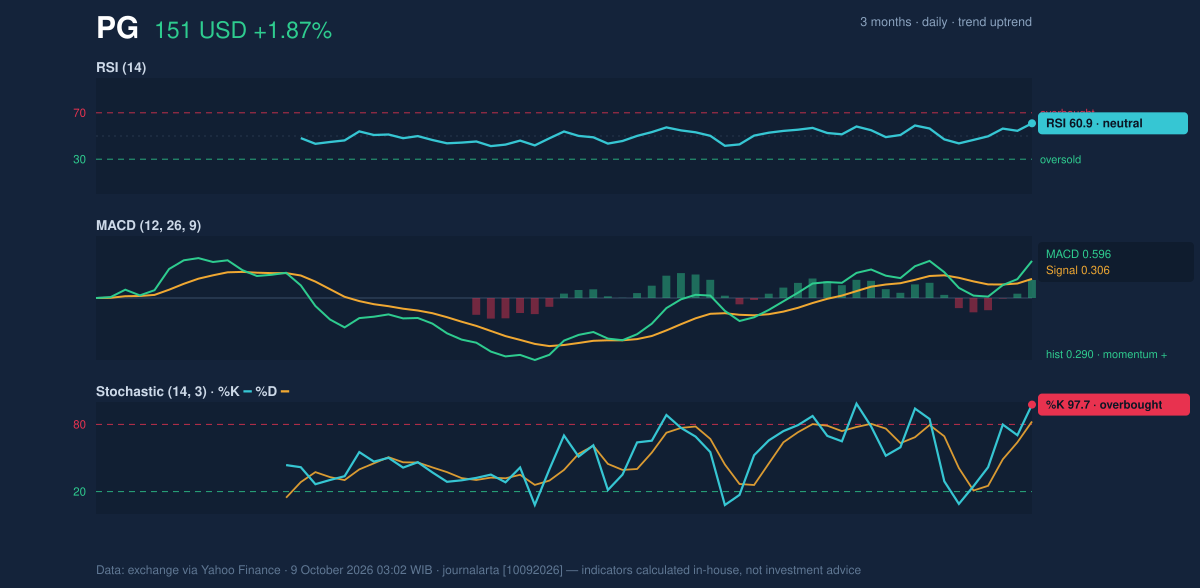
Volatility, Volume & Levels
Volume was 12,047,500 shares, about 1.4 times the 20-day average of 8,334,320, while the on-balance volume (OBV) indicator is rising. OBV uses volume to track whether trading activity is more associated with buying or selling; its increase lends participation-based support to the price advance. The session therefore had stronger-than-usual activity behind it, rather than relying on a thin trade. Average true range (ATR), a measure of typical daily price movement, is $2.47, or 1.6% of the share price, pointing to moderate volatility. The three-month range runs from $140.20 to $154.32. If PG holds above the $149.94 upper band, the next reference is the three-month high at $154.32; failure to hold the breakout area would put the $146.84 20-day average and then $143.95 support from the 20-day range in focus. A close below $143.95 would weaken the current setup.Technical Verdict: HOLD (wait & see)
The indicators support an upward trend, but the shares are testing resistance after a rapid advance. The verdict rests on three signals: price above both moving averages with the 20-day SMA rising; positive MACD and rising OBV confirming momentum and participation; and an overbought Stochastic reading alongside a price above the upper Bollinger Band, which raises the chance of near-term consolidation. The verdict is invalidated if price falls below $143.95.- Ideal Entry Range: $146.84–$149.94, using the 20-day SMA and upper Bollinger Band as reference levels for a possible retest.
- Exit Target (Target Price): $154.32, the three-month high and next stated resistance reference.
- Stop Loss protection: $143.95, the 20-day support level.
Summary Data PG
| Last price | 150.59 USD |
| Change 1 day / 5 days / 1 month | 1.87% / 4.61% / 5.33% |
| Trend / MA-cross | uptrend / none |
| SMA20 / SMA50 | 146.84 / 145.77 |
| RSI (14) / Stochastic %K | 60.9 / 97.7 |
| Bollinger %B / ATR | 110% / 2.47 |
| Support / Resistance 20 days | 143.95 / 150.59 |
| Data as of | 9 October 2026 03:02 WIB |
Disclaimer: This technical analysis is generated automatically from exchange data (via Yahoo Finance) and indicators calculated by JournalArta, for information and education only. The verdict and the entry, target and stop-loss levels are not investment advice or a solicitation to buy or sell any security. Investment decisions and their risks rest solely with the reader.
Track PG stock price daily: live levels, support/resistance and our full PG analysis history.