BP Stock Analysis: Drops 3.35%, Momentum Gains
On Agustus 25, 2026: price 533.70 GBp, trend sideways, RSI 60.2, support 514.90, resistance 552.50. technical analysis of bp stock. BP Stock Analysis — full…
BP plc is trading in a narrow technical corridor, with the latest move showing a modest pullback even as medium-term momentum remains constructive. For international readers, the key question is whether the shares are consolidating for another attempt higher or simply drifting sideways inside a well-defined range.
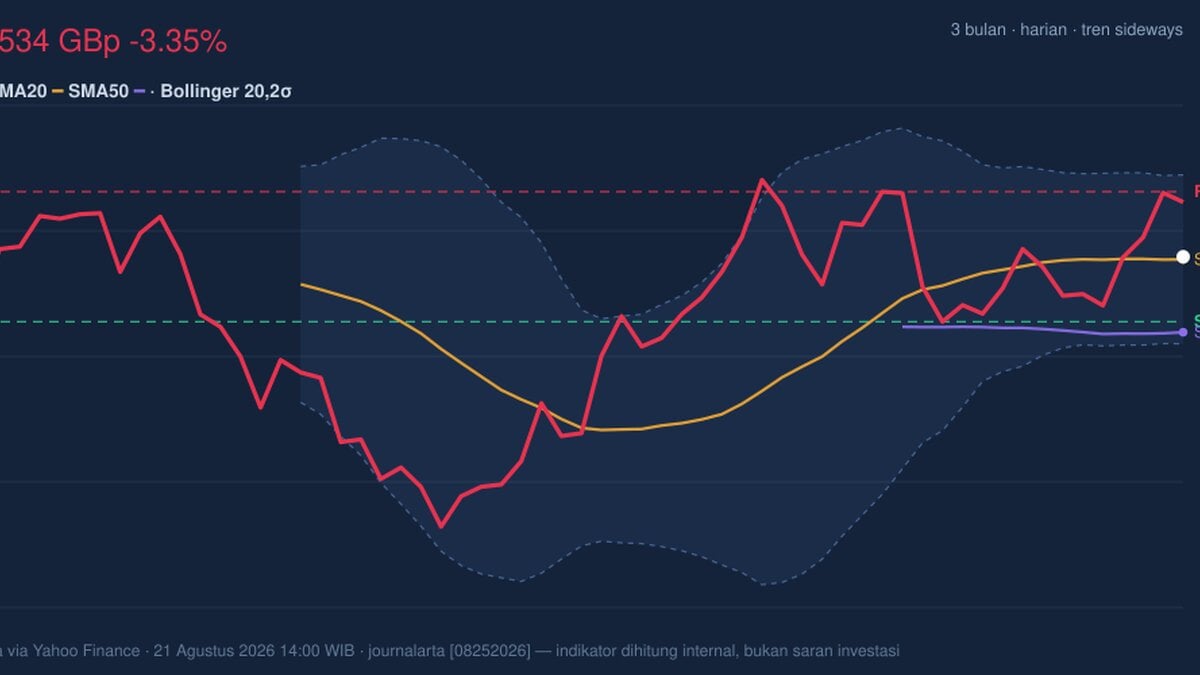
At 533.70 GBp, BP closed below the previous session’s 552.20 GBp level, down 3.35% on the day, but the broader tape is less dramatic than that single move suggests. The stock is still sitting above its SMA20 at 532.92 and comfortably above its SMA50 at 511.86, which matters because it shows the medium-term trend has not broken down. In plain terms: the share price is not trending sharply higher, but it is also not losing its footing.
Trend & Price Action
The chart shows BP in a sideways trend, with the SMA20 slope essentially flat at -0.01% over 5 days. That is a classic sign of consolidation rather than a strong directional move. When a stock trades close to its short-term average and the average itself is flat, the market is usually waiting for a catalyst — in this case, either a break above resistance or a slip back toward support.
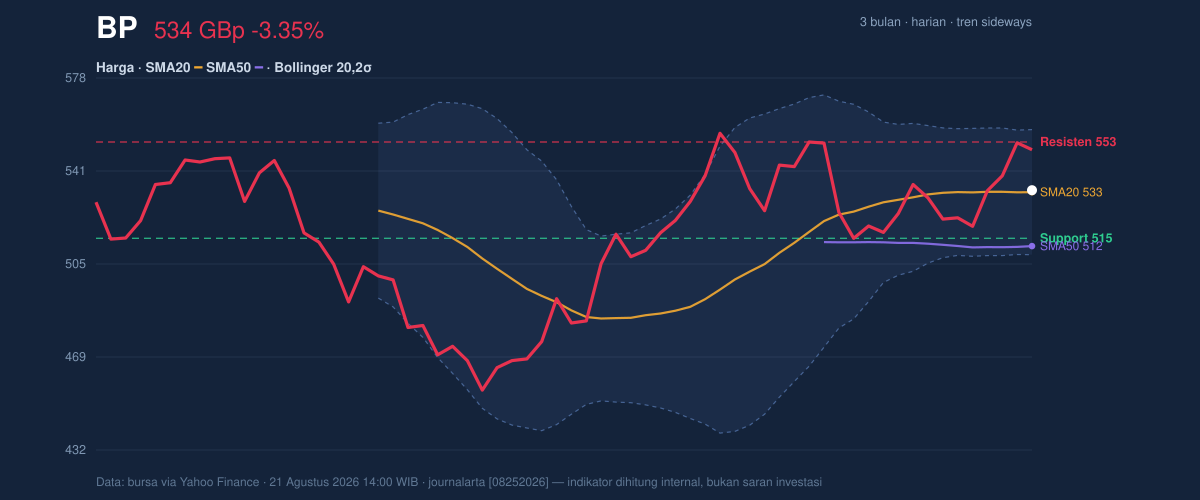
The most important structure is the stock’s position within the recent range. BP is trading around the middle of the 20-hour support at 514.90 and 20-hour resistance at 552.50 band, and the latest price is also just above the Bollinger middle line at 532.92. That placement suggests balance, not urgency. The shares are not stretched to the upside, but nor are they deeply discounted. The 3-month high of 562.90 remains the near-term ceiling to watch, while 450.60 marks the lower end of the broader recent range.
The Bollinger setup reinforces that reading. The bands are relatively tight, with a 9.2% width, which points to normal volatility rather than an explosive squeeze. Price sitting at 52% %B means BP is roughly in the middle of the band structure — not overbought at the top band, not oversold at the bottom. That usually signals a market that is digesting prior gains and waiting for direction.
Oscillators & Momentum
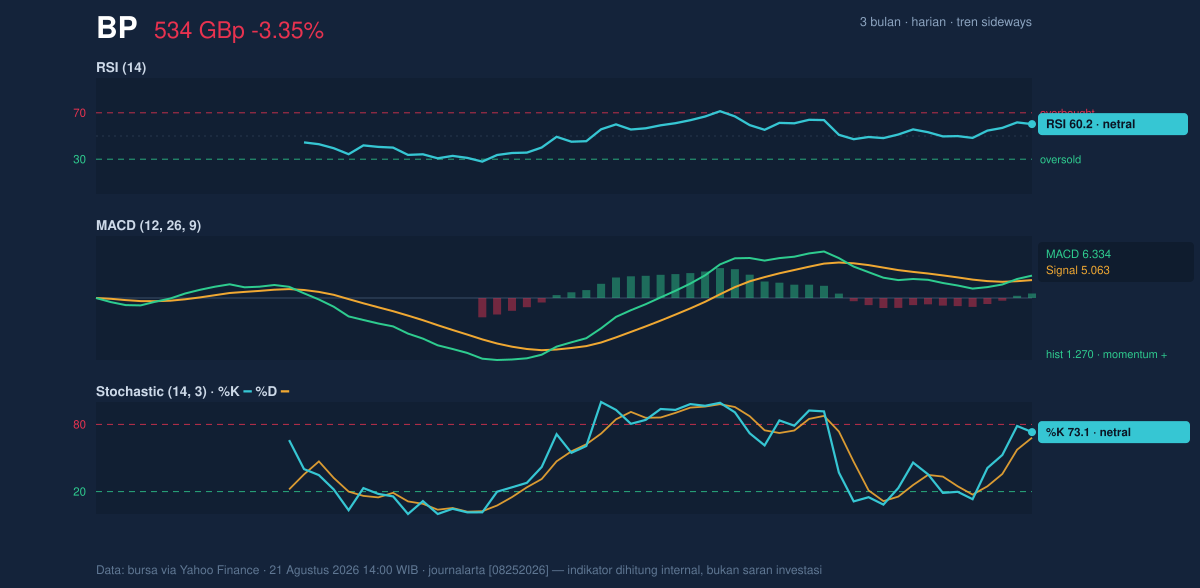
The momentum picture is more supportive than the headline daily drop might imply. RSI at 60.2 is neutral-to-firm, which means buyers still have some control without the stock being stretched into obvious overbought territory. Stochastic %K at 73.1 and %D at 68.1 are also neutral, but they sit near the upper part of the range, telling us the shares have retained upward pressure even after the recent dip.
The clearest positive signal comes from MACD. MACD at 6.334 sits above its signal line at 5.063, with a positive histogram of 1.270. In technical terms, that means near-term momentum is still leaning upward even though price action has gone quiet. This is important because MACD often confirms whether a sideways market is merely pausing or quietly building another leg. Here, the indicator alignment suggests the latter is still possible, but not yet confirmed by price.
The volume and breadth backdrop also help. Last volume was 54,092,424, versus a 20-session average of 52,872,661, or about 1.0× normal. That is not a surge, but it is enough to show participation rather than a thin, unreliable drift. More importantly, OBV is rising, which indicates that volume has generally been flowing into the stock over time. Rising OBV alongside a price that is holding above its short and medium moving averages is usually a sign that accumulation is still present, even if it is not aggressive.
Volatility remains contained. ATR at 14.26, or 2.7% of price, suggests a moderate daily range. For readers less familiar with the term, ATR measures how much a stock typically moves in a session; a moderate reading means BP is not behaving like a high-stress, high-swing name right now.
Key Levels & Scenarios
The chart leaves two obvious decision points. The first is the 514.90 support area. If BP holds above that zone, the current sideways structure remains intact and the market can continue to work around the middle of the Bollinger range. The second is 552.50 resistance. A move through that area would be the first sign that the recent consolidation is resolving to the upside, with the 562.90 three-month high then becoming the next reference point.
If price fails to hold 514.90, the message would be different: the stock would be moving back toward the lower half of its recent range and challenging the idea that the medium-term trend is stable. Because the SMA20 is only marginally above price, a break below that support would also weaken the case that the current pause is constructive.
Technical Verdict: HOLD (wait & see)
HOLD (wait & see)
- MACD is positive, with the line above signal and a green histogram, showing momentum has not fully rolled over.
- Price is above SMA20 and SMA50, which keeps the medium-term structure intact.
- Bollinger bands are normal-width and price is mid-band, pointing to consolidation rather than a decisive breakout.
Verdict invalidated if price falls below 514.90.
- Ideal Entry Range: 514.90 to 532.92 GBp
- Exit Target: 552.50 GBp, with 562.90 as the next technical reference if resistance gives way
- Stop Loss protection: below 508.49 GBp
For non-traders, this means BP is not flashing a strong breakout signal yet, but the chart still shows enough underlying support to keep the shares in a constructive holding pattern. The next technical test is 552.50 resistance.
Summary Data BP
| Last price | 533.70 GBp |
| Change 1 day / 5 days / 1 month | -3.35% / 2.07% / -2.68% |
| Trend / MA-cross | sideways / none |
| SMA20 / SMA50 | 532.92 / 511.86 |
| RSI (14) / Stochastic %K | 60.2 / 73.1 |
| Bollinger %B / ATR | 52% / 14.26 |
| Support / Resistance 20 days | 514.90 / 552.50 |
| Data as of | 21 Agustus 2026 14:00 WIB |
Track BP share price daily: live levels, support/resistance and our full BP analysis history.