LSEG Stock Gains 1.85% on Thursday, Testing Key Resistance
On October 8, 2026: price 8,470.00 GBp, trend sideways, RSI 54.1, support 8,090.00, resistance 8,474.00. technical analysis of lseg stock.
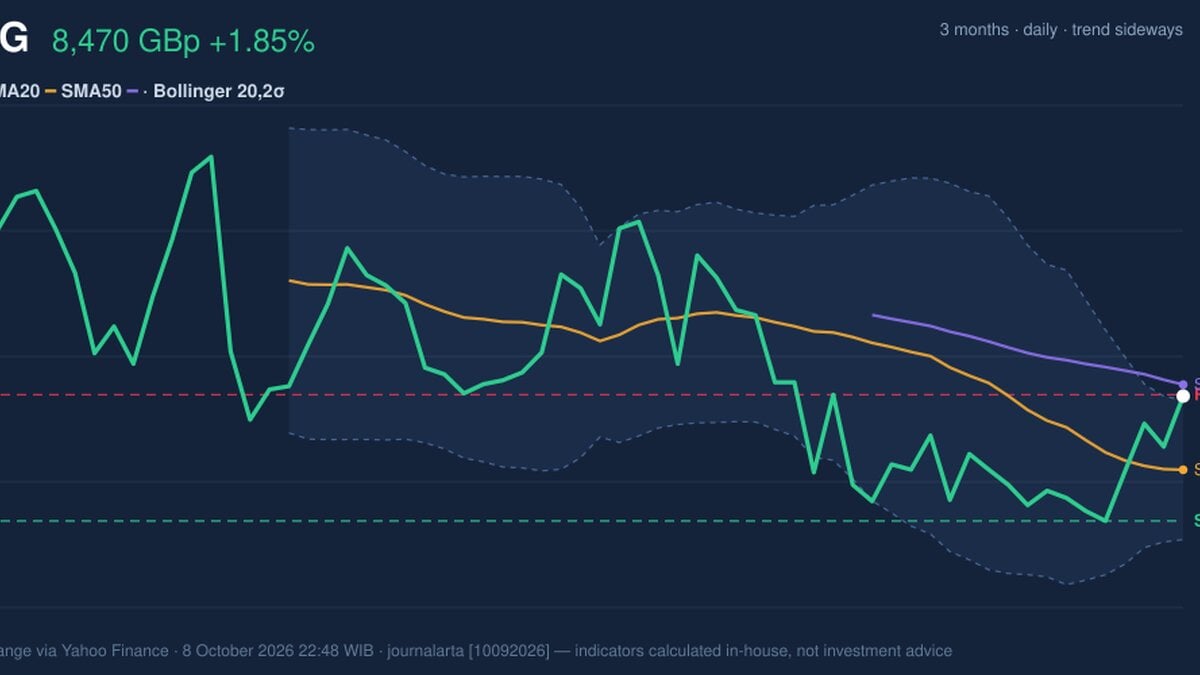
Why LSEG is in focus today
- Breaking out of a Bollinger squeeze (band width 5.1%)
- Not covered by JournalArta in the last 14 days
Selected automatically from 16 LSE (UK) stocks by a technical-signal score with daily weighted randomisation — not a recommendation.
Trend & Price Action
The share price is above its SMA20 of 8,245.80, but remains below its SMA50 of 8,505.04. The 20-day average is sloping down, while no fresh moving-average crossover has formed. This leaves the broader technical picture sideways rather than establishing a clear upward trend. LSEG gained 4.31% over five trading days, although it was down 0.49% over one month. That contrast suggests a recent rebound within a still-uncertain wider pattern. At 8,470.00, the price is also close to the 20-day resistance at 8,474.00—a level that may test whether buyers can sustain the advance. As shown in the chart, the price has moved just above the upper Bollinger Band at 8,458.13. The band width is 5.1% and narrowing, a squeeze that can precede a larger move, but does not by itself reveal its direction. The current reading above the band signals a forceful short-term push; it also means the price has stretched beyond its recent volatility envelope.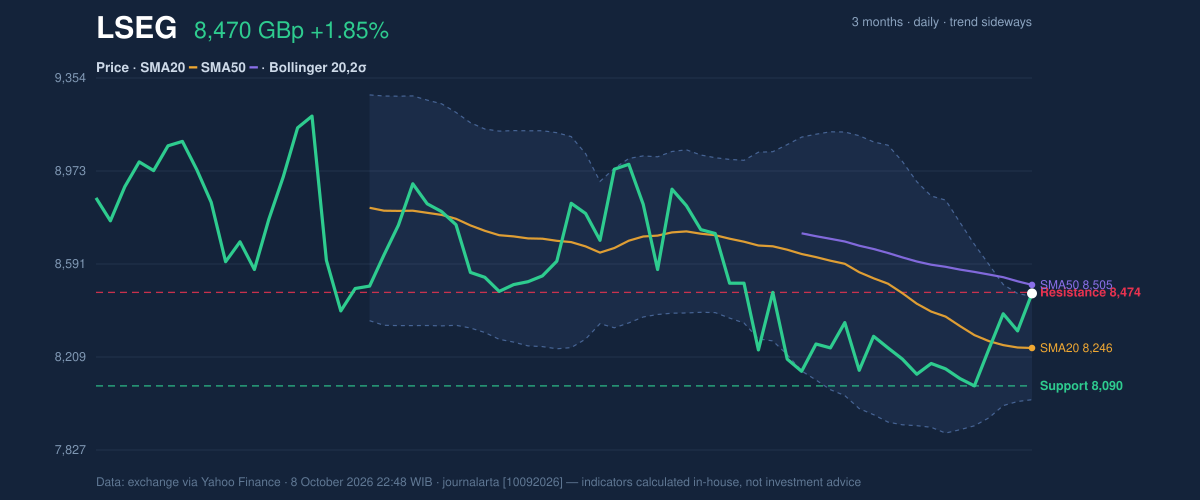
Oscillators & Momentum
Momentum is positive in the MACD calculation: its histogram is 41.383, with the MACD at -65.110 above its signal line at -106.493. The improving relationship points to strengthening momentum, though both MACD lines remain below zero, which tempers the case for a decisive trend reversal. The RSI is neutral at 54.1, indicating neither strong buying pressure nor an oversold rebound. By contrast, the Stochastic is overbought, with %K at 100.0 and %D at 91.0. Stochastic compares a close with the recent price range; readings near the top can reflect strong momentum, but also warn that a pause or pullback may follow. As shown in the chart, the indicators therefore offer mixed confirmation: MACD is improving, RSI remains balanced, and Stochastic is stretched.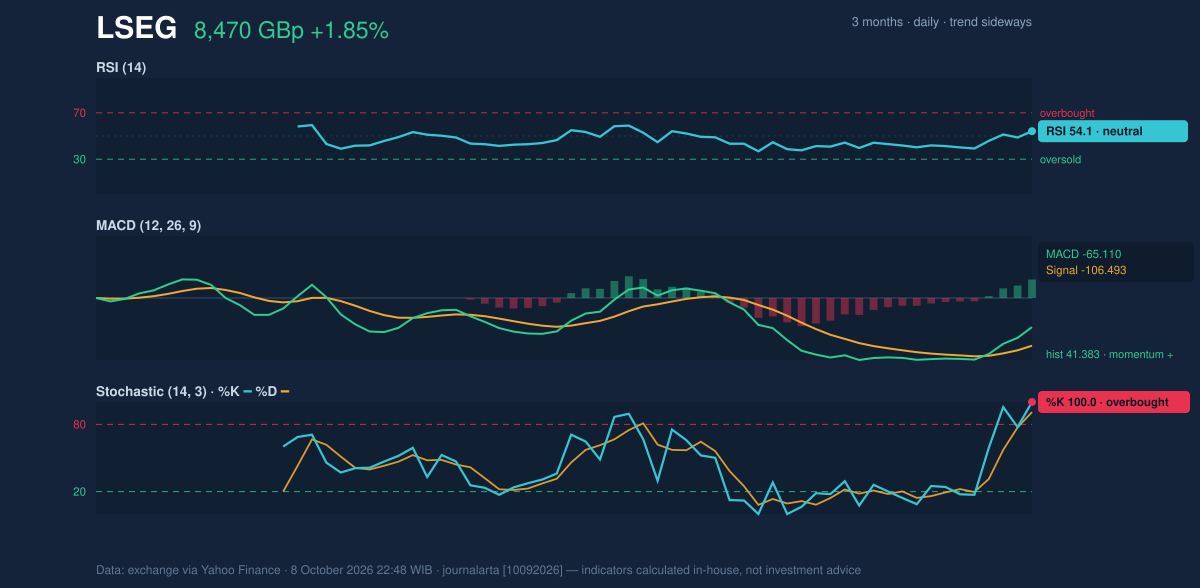
Volatility, Volume & Key Levels
The breakout attempt has little participation behind it. The latest volume was 1,564 shares, compared with a 20-day average of 1,421,919—effectively 0.0× average volume in the supplied data—and OBV is falling. OBV tracks whether volume tends to accompany rising or falling prices; its decline, alongside thin turnover, weakens confidence that the move reflects broad accumulation. Volatility remains elevated: ATR is 768.07, or 9.1% of the share price. ATR estimates the typical size of price moves, not their direction, so it underscores the risk of sharp swings around nearby levels. The 20-day support stands at 8,090.00. A sustained move above 8,474.00, preferably with stronger volume, would provide firmer evidence that resistance has given way; failure to hold above the SMA20 would instead put support back in focus.Technical Verdict: HOLD (wait & see)
The indicators support a neutral, wait-and-see reading rather than a confirmed directional signal. The price is above the SMA20 and MACD momentum is positive, but the shares remain below the SMA50, Stochastic is overbought, and thin volume with declining OBV casts doubt on the breakout’s strength. The narrowing Bollinger Bands indicate that a larger move may be developing, not that an upside move is assured. - Ideal Entry Range: 8,245.80–8,474.00 GBp, bounded by the SMA20 and 20-day resistance. - Exit Target: 8,505.04 GBp, the SMA50, as a nearby technical reference rather than a forecast. - Stop Loss protection: 8,090.00 GBp, the 20-day support level. - Invalidation: The neutral verdict is invalidated if the price falls below 8,090.00 GBp. In plain English, the chart shows a recent push higher, but not enough confirmation yet to establish a reliable trend. | Technical data | Reading | |---|---:| | Last price | 8,470.00 GBp | | Daily change | +1.85% | | Five-day change | +4.31% | | One-month change | -0.49% | | SMA20 / SMA50 | 8,245.80 / 8,505.04 | | Bollinger upper / middle / lower | 8,458.13 / 8,245.80 / 8,033.47 | | RSI(14) | 54.1 | | Stochastic %K / %D | 100.0 / 91.0 | | MACD / signal / histogram | -65.110 / -106.493 / 41.383 | | ATR(14) | 768.07 | | 20-day support / resistance | 8,090.00 / 8,474.00 |Summary Data LSEG
| Last price | 8,470.00 GBp |
| Change 1 day / 5 days / 1 month | 1.85% / 4.31% / -0.49% |
| Trend / MA-cross | sideways / none |
| SMA20 / SMA50 | 8,245.80 / 8,505.04 |
| RSI (14) / Stochastic %K | 54.1 / 100.0 |
| Bollinger %B / ATR | 103% / 768.07 |
| Support / Resistance 20 days | 8,090.00 / 8,474.00 |
| Data as of | 8 October 2026 22:48 WIB |
Disclaimer: This technical analysis is generated automatically from exchange data (via Yahoo Finance) and indicators calculated by JournalArta, for information and education only. The verdict and the entry, target and stop-loss levels are not investment advice or a solicitation to buy or sell any security. Investment decisions and their risks rest solely with the reader.
Track LSEG share price daily: live levels, support/resistance and our full LSEG analysis history.