Lloyds Stock Analysis: Drops 1.66%, Testing Support Level
On October 8, 2026: price 100.60 GBp, trend downtrend, RSI 33.0, support 100.60, resistance 112.20. technical analysis of lloyds stock.
Trend & Price Action
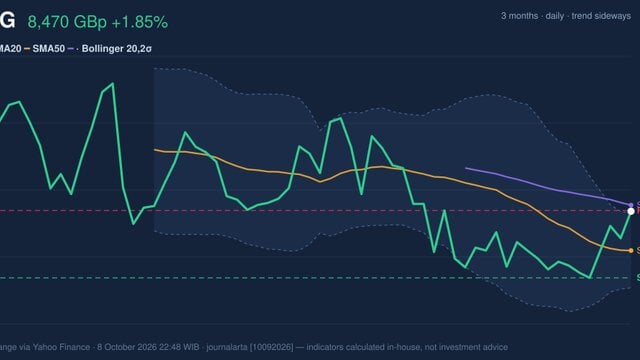
Lloyds ended at 100.60 pence, below the 20-day SMA of 107.23 and the 50-day SMA of 110.66. There has been no new crossover between the averages, so the signal is not a newly formed bearish cross; instead, the price’s position below both lines shows that recent trading remains weaker than its average over either period. The 20-day SMA has fallen 1.84% over five days. That declining slope indicates the short-term trend itself is deteriorating, not merely lagging behind the share price. The 20-day support is also at 100.60, leaving the close exactly on that reference level. A decisive move below it would put the current support under pressure; holding there would be necessary to interrupt the immediate decline. Price is at the bottom of its 20-day range, with support at 100.60 pence and resistance at 112.20 pence. As shown in the chart, the share price is also below the Bollinger middle band, which coincides with the 20-day SMA.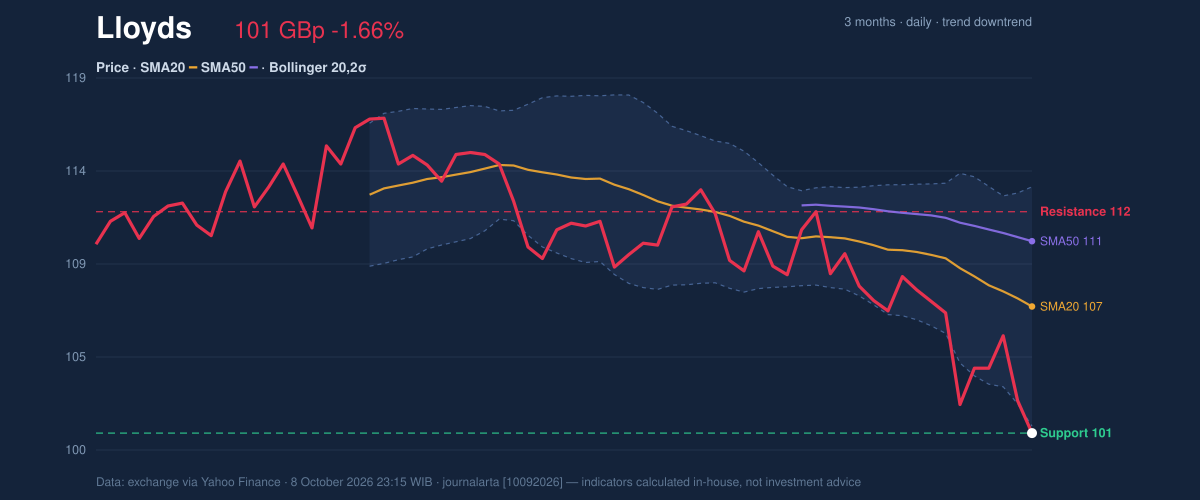
Oscillators & Momentum
Momentum indicators are mixed, but the more directional signal remains negative. The 14-day Relative Strength Index (RSI), a gauge of recent price momentum, stands at 33.0, classified as neutral in the supplied data. It is low but does not, by itself, confirm a reversal or an oversold condition. The Stochastic reading shows a sharper short-term split: %K is 90.6 and %D is 46.0, with %K in overbought territory. The indicator compares recent closes with the prevailing trading range. Its elevated %K can reflect a quick bounce within a broader decline; without price confirmation, it does not negate the downtrend. The MACD, which compares shorter- and longer-term price momentum, remains below its signal line. MACD is -2.273, the signal is -1.712 and the histogram is -0.562. A negative histogram means downside momentum is still stronger than the signal line suggests, consistent with the falling moving average and lower share price.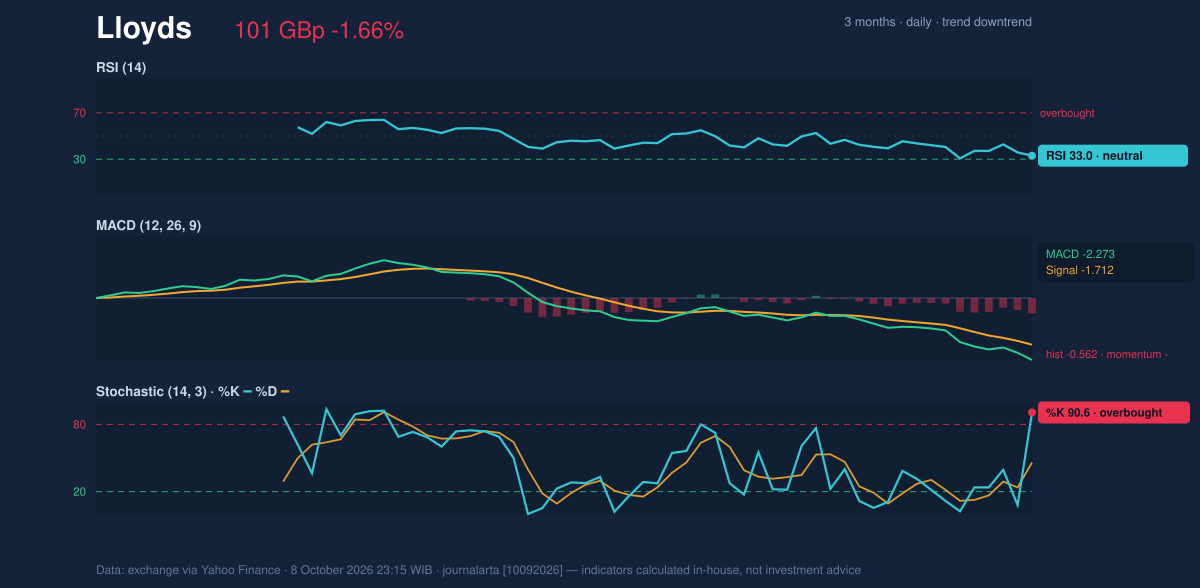
Volatility & Volume
The close sits below the lower Bollinger Band at 100.96, with %B at -3%. Bollinger Bands widen or narrow with price volatility; a reading below the lower band shows the price has pushed beyond its usual statistical envelope, but does not prove that a rebound is imminent. The band width of 11.7% is described as normal, rather than a squeeze that might signal an impending expansion in trading activity. Volatility remains high: the 14-day Average True Range (ATR), a measure of typical price movement, is 9.74 pence, or 9.7% of the share price. That makes moves around support and resistance more consequential and less predictable. Participation offers little confirmation of a recovery: volume was 44,217,420 shares, just 0.2 times its 20-day average of 177,679,146, while On-Balance Volume (OBV), which tracks whether volume accompanies buying or selling, is falling. The low turnover means the latest move came on thin trading, but the declining OBV does not show accumulation.Technical Verdict: HOLD (wait & see)
The technical verdict is HOLD (wait & see), reflecting a weak trend with no confirmed reversal. The price is below both SMAs and the 20-day average is falling; MACD and its negative histogram confirm downside momentum; and OBV is declining. The RSI is neutral and the close below the lower Bollinger Band may precede a rebound, but neither signal confirms one. The verdict is invalidated if price breaks below 100.60 pence. The levels below are analytical reference points drawn only from the supplied support, resistance, and moving-average data: - Ideal entry range: 100.60–107.23 pence, spanning 20-day support to the 20-day SMA. - Exit target: 112.20 pence, the 20-day resistance level. - Stop-loss protection: below 100.60 pence, the stated 20-day support. For non-traders, this means the chart remains weak, while a sustained hold above support or a move back above the short-term average would be needed to improve the technical picture.Source: LSE market data via Yahoo Finance, as of 8 October 2026, 23:15 WIB.
Why Lloyds is in focus today
- Closed at a 20-day low (100.60)
- Downtrend extending (5-day change -1.47%)
- Not covered by JournalArta in the last 14 days
Selected automatically from 16 LSE (UK) stocks by a technical-signal score with daily weighted randomisation — not a recommendation.
Summary Data Lloyds
| Last price | 100.60 GBp |
| Change 1 day / 5 days / 1 month | -1.66% / -1.47% / -7.79% |
| Trend / MA-cross | downtrend / none |
| SMA20 / SMA50 | 107.23 / 110.66 |
| RSI (14) / Stochastic %K | 33.0 / 90.6 |
| Bollinger %B / ATR | -3% / 9.74 |
| Support / Resistance 20 days | 100.60 / 112.20 |
| Data as of | 8 October 2026 23:15 WIB |
Disclaimer: This technical analysis is generated automatically from exchange data (via Yahoo Finance) and indicators calculated by JournalArta, for information and education only. The verdict and the entry, target and stop-loss levels are not investment advice or a solicitation to buy or sell any security. Investment decisions and their risks rest solely with the reader.
Track Lloyds share price daily: live levels, support/resistance and our full Lloyds analysis history.