Diageo Stock Analysis: Gains 0.68%, Testing Key Resistance
On October 8, 2026: price 1,622.00 GBp, trend sideways, RSI 49.3, support 1,575.50, resistance 1,643.00. technical analysis of diageo stock.
Why Diageo is in focus today
- MACD histogram has just turned positive
- Not covered by JournalArta in the last 14 days
Selected automatically from 16 LSE (UK) stocks by a technical-signal score with daily weighted randomisation — not a recommendation.
Trend & Price Action
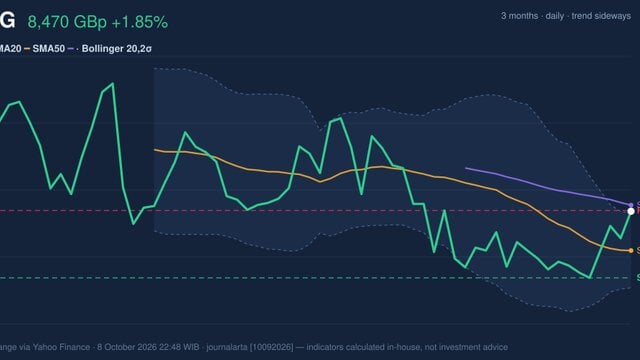
Diageo is moving sideways: its 20-day simple moving average (SMA) slopes down 0.29% over five days, while the latest price sits just above the SMA20 at 1,616.65 GBp and below the SMA50 at 1,663.71 GBp. That split suggests near-term support has improved, but the broader price structure has not yet regained the longer average. No new moving-average crossover has formed. The shares are at 69% of their 20-day range, between support at 1,575.50 GBp and resistance at 1,643.00 GBp. The position leaves less room before resistance than support, making a break above the range ceiling more meaningful than another small daily gain. As shown in the chart, the price is also between the Bollinger Bands rather than pressing either boundary.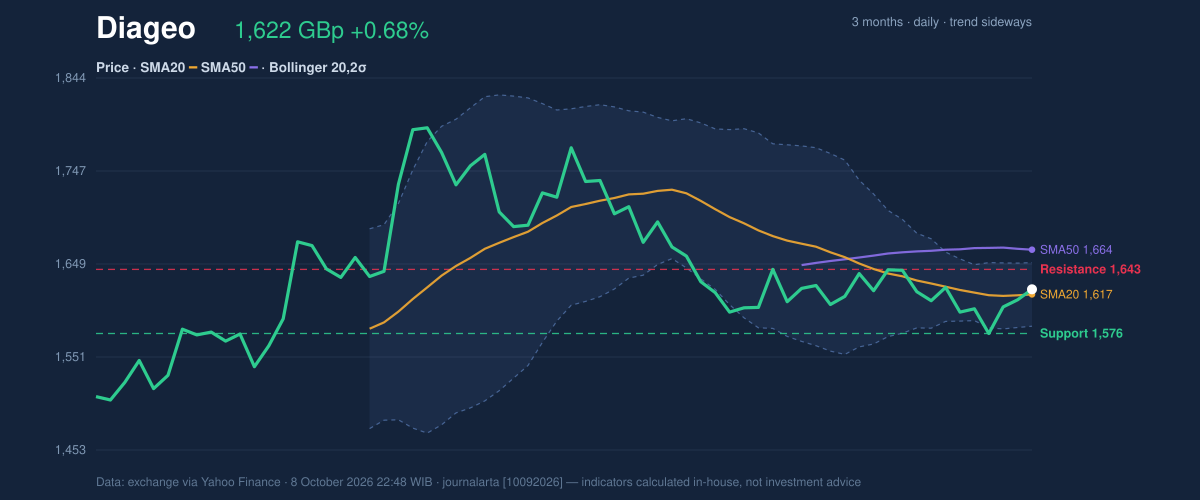
Oscillators & Momentum
Momentum indicators are mixed. The RSI at 49.3 is neutral, consistent with a market that has not established strong directional control. The MACD remains below zero, but its histogram has turned positive to 1.055, with MACD at -12.385 against a signal line of -13.440. In plain terms, the recent downward momentum is easing; the signal is encouraging, but it does not yet show that the price has entered a sustained uptrend. The Stochastic %K at 97.5, above %D at 56.5, is overbought. That reading points to a rapid short-term rise and raises the chance of a pause or pullback, particularly near resistance. It can persist during a breakout, so it is a caution rather than proof that prices must fall.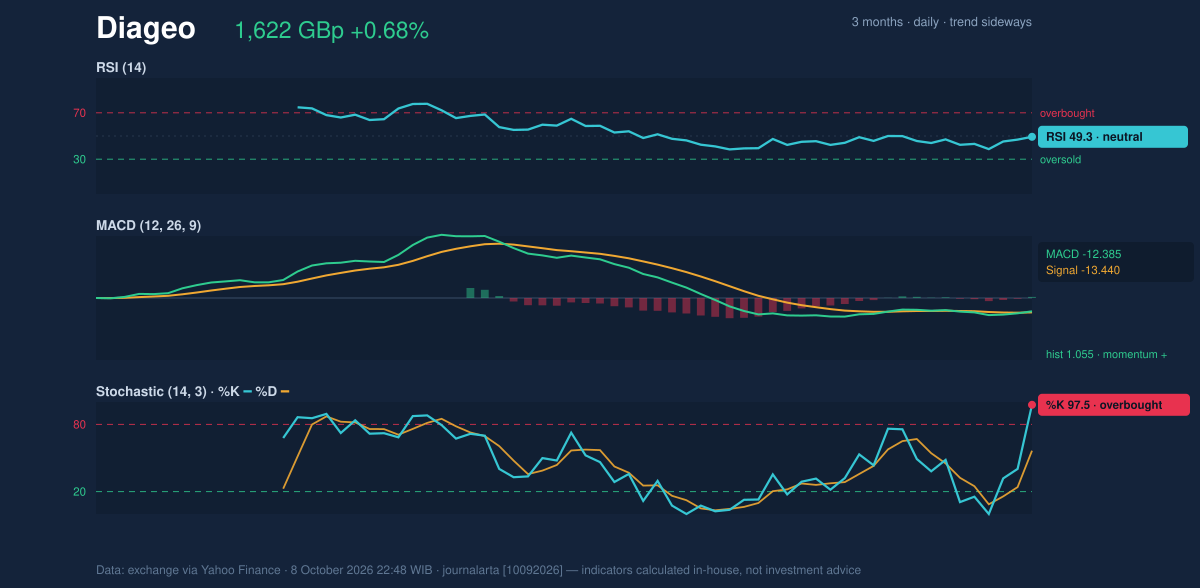
Volatility & Volume
The Bollinger Band width is just 4.1%, and the bands are narrowing. A squeeze means recent price variation has contracted; it can precede a larger move, but does not indicate its direction. Diageo’s %B reading of 58% places the price somewhat above the bands’ midpoint, not at an extreme. The upper band at 1,650.11 GBp is close to the 20-day resistance area, creating a nearby test if the shares continue higher. Volatility remains high despite the narrow bands: the 14-day average true range (ATR), a measure of typical trading movement, is 143.81 GBp, or 8.9% of the share price. Volume offers little confirmation for the latest rise. The reported last volume of 127 compares with a 20-day average of 4,777,592, which the data classifies as thin; on such a mismatch, the daily move is a weak measure of broad market participation. On the other hand, OBV—the running balance of trading volume adjusted for whether prices rose or fell—is rising, a constructive but qualified signal.Key Levels & Scenarios
A move through 1,643.00 GBp resistance would put the upper Bollinger Band at 1,650.11 GBp in focus, followed by the SMA50 at 1,663.71 GBp. Clearing those levels would strengthen the case that momentum is shifting beyond a short-lived bounce. If the price fails at resistance, the SMA20 at 1,616.65 GBp is the first reference point; a fall through 1,575.50 GBp support would undermine the current near-term improvement.Technical Verdict: HOLD (wait & see)
The technical picture warrants a neutral verdict: MACD momentum has improved, but the price is still below the SMA50, the Stochastic is overbought, and exceptionally thin volume leaves the latest advance poorly confirmed. The narrowing Bollinger Bands point to a possible breakout, not a confirmed direction. - Illustrative entry range: 1,616.65–1,643.00 GBp, bounded by the SMA20 and 20-day resistance. - Illustrative exit target: 1,650.11–1,663.71 GBp, the upper Bollinger Band to SMA50 zone. - Illustrative stop-loss protection: below 1,575.50 GBp, the 20-day support. - Invalidation: the verdict is invalidated if the price falls below 1,575.50 GBp. For non-traders, this means Diageo has early signs of improving momentum, but the trend has not yet confirmed a decisive move. Market data below were reported for 8 October 2026 at 22:48 WIB.Summary Data Diageo
| Last price | 1,622.00 GBp |
| Change 1 day / 5 days / 1 month | 0.68% / 1.50% / 1.22% |
| Trend / MA-cross | sideways / none |
| SMA20 / SMA50 | 1,616.65 / 1,663.71 |
| RSI (14) / Stochastic %K | 49.3 / 97.5 |
| Bollinger %B / ATR | 58% / 143.81 |
| Support / Resistance 20 days | 1,575.50 / 1,643.00 |
| Data as of | 8 October 2026 22:48 WIB |
Disclaimer: This technical analysis is generated automatically from exchange data (via Yahoo Finance) and indicators calculated by JournalArta, for information and education only. The verdict and the entry, target and stop-loss levels are not investment advice or a solicitation to buy or sell any security. Investment decisions and their risks rest solely with the reader.
Track Diageo share price daily: live levels, support/resistance and our full Diageo analysis history.