Genting Singapore Testing Support Level: Stock Drops 0.81% (October 8, 2026)
On October 8, 2026: price 0.62 SGD, trend sideways, RSI 44.7, support 0.62, resistance 0.63. technical analysis of genting singapore stock.
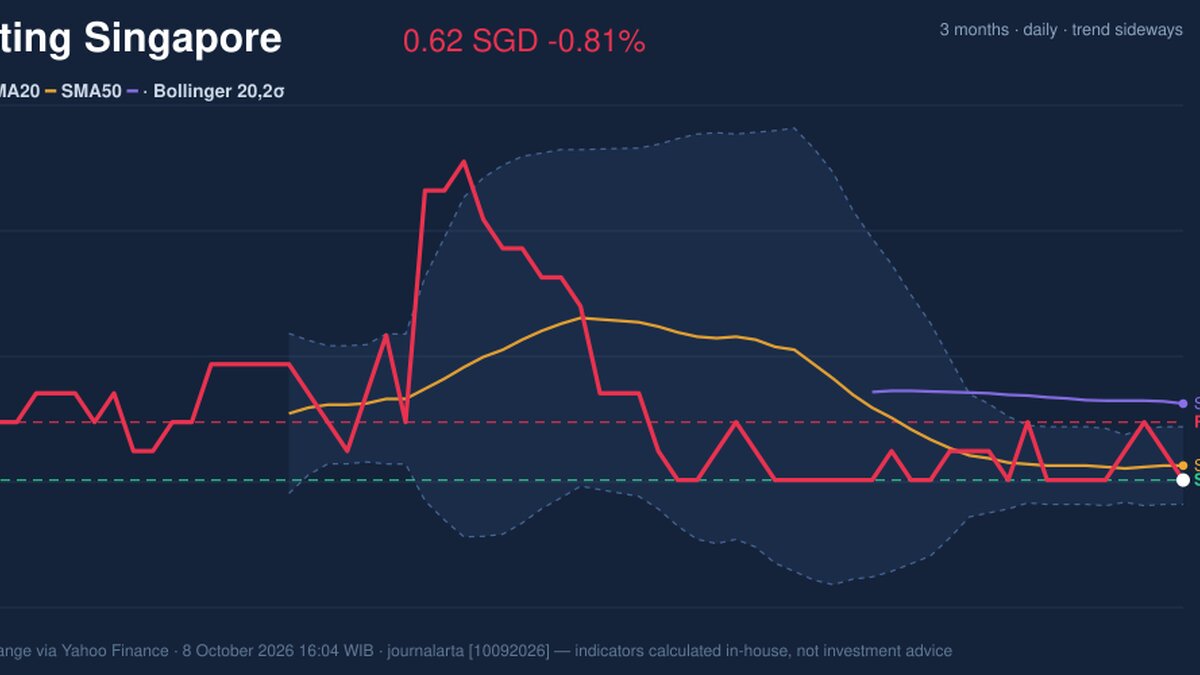
Why Genting Singapore is in focus today
- Closed at a 20-day low (0.62)
- Trading near its 3-month low (0.61)
- Not covered by JournalArta in the last 14 days
Selected automatically from 16 SGX (Singapore) stocks by a technical-signal score with daily weighted randomisation — not a recommendation.
Trend & Price Action
The price sits at the bottom of its 20-day range, with S$0.62 support and S$0.63 resistance. It is below the SMA20 at S$0.62 and the SMA50 at S$0.63, while the 20-day average has been flat over five days. There is no recent moving-average crossover, so the chart offers little evidence of a sustained trend. The gap between price and its short-term average is slight, but the position below both reference levels keeps the near-term structure cautious. As shown in the chart, the Bollinger Bands — a measure of how widely price has moved around its average — have narrowed to a 2.2% width. Such a squeeze signals subdued trading, not a direction: a move beyond the band may indicate that volatility is returning, but it does not establish whether the next move will be higher or lower.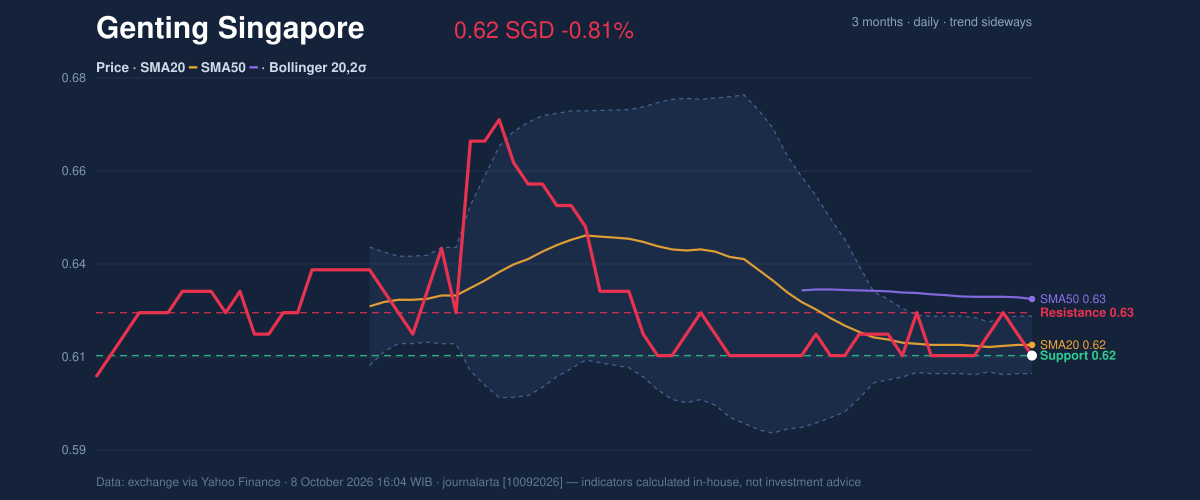
Oscillators & Momentum
Momentum measures are mixed rather than decisive. RSI at 44.7 is neutral, showing neither strong buying pressure nor an oversold reading. The Stochastic readings, with %K at 40.0 and %D at 60.0, are also neutral; the lower %K suggests weaker short-term momentum, but not a clear reversal signal. The MACD is more constructive: its histogram is positive at 0.001, with MACD at -0.002 above the signal line at -0.003. This indicates that downward momentum has eased and may be turning upward. Yet the signal is modest and sits alongside a flat share price, neutral oscillators and falling OBV, a measure of whether trading volume is accumulating on rising days or draining on weaker sessions. The combination points to tentative improvement, not broad confirmation.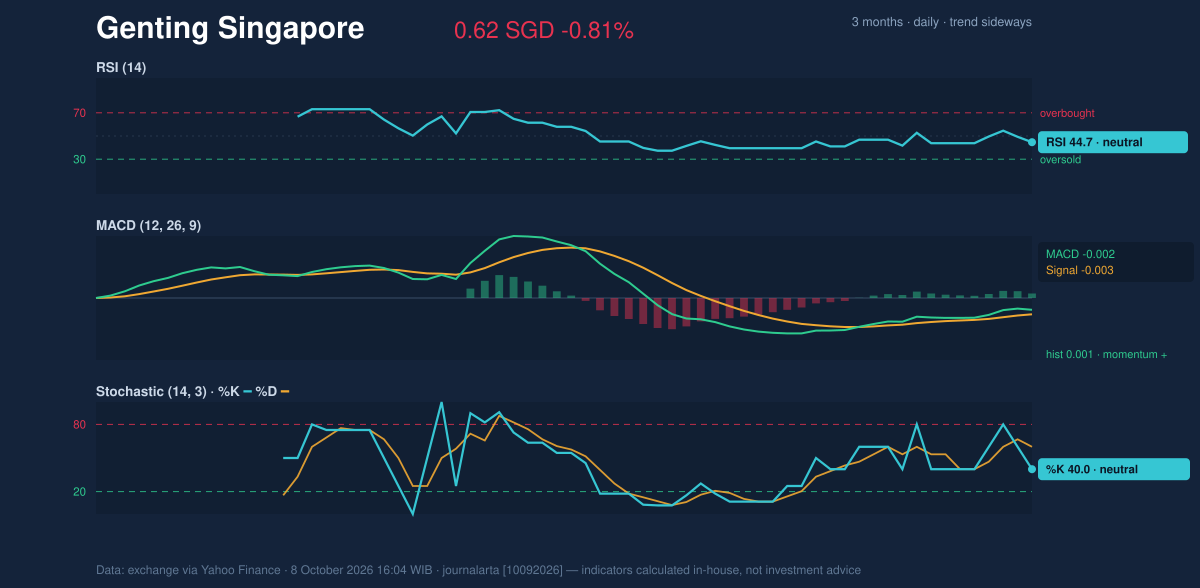
Volatility, Volume & Scenarios
Trading volume was 14.66 million shares, about 0.9 times the 20-day average of 16.77 million. That below-average activity limits the strength of the latest price signal: the close at support did not come with unusually heavy turnover, but falling OBV also suggests participation has not been building. ATR, which estimates typical daily price movement, stands at S$0.01, or 1.7% of the share price, consistent with moderate volatility. The immediate test is whether S$0.62 holds. A sustained move above S$0.63 resistance would clear the top of the recent range and could give the positive MACD reading greater credibility. A failure to hold S$0.62 support would put the three-month low of S$0.61 in focus. The tight Bollinger squeeze makes either boundary relevant, but the indicators do not yet confirm a breakout.Technical Verdict: HOLD
The technical reading supports HOLD (wait & see) rather than a directional call. The strongest reasons are the flat trend with price below the SMA20 and SMA50; neutral RSI and Stochastic readings; and a positive but still limited MACD histogram, set against falling OBV. The verdict is invalidated if the price falls below S$0.61, the three-month low.- Ideal entry range: S$0.61–S$0.62, around the identified support zone.
- Exit target: S$0.63, the 20-day resistance and SMA50 level.
- Stop-loss protection: Below S$0.61, the three-month low.
| Indicator | Reading |
|---|---|
| Last price | S$0.62 |
| Change | 1 day -0.81% | 5 days 0.00% | 1 month 0.00% |
| SMA20 / SMA50 | S$0.62 / S$0.63 |
| Bollinger Bands | Upper S$0.62 | Middle S$0.62 | Lower S$0.61 | Width 2.2% |
| RSI / Stochastic | 44.7 | %K 40.0 / %D 60.0 |
| MACD / histogram | -0.002 / 0.001 |
| ATR | S$0.01 (1.7%) |
| Volume / 20-day average | 14,658,500 / 16,765,995 |
| Support / resistance | S$0.62 / S$0.63 |
| Three-month high / low | S$0.68 / S$0.61 |
Summary Data Genting Singapore
| Last price | 0.62 SGD |
| Change 1 day / 5 days / 1 month | -0.81% / 0.00% / 0.00% |
| Trend / MA-cross | sideways / none |
| SMA20 / SMA50 | 0.62 / 0.63 |
| RSI (14) / Stochastic %K | 44.7 / 40.0 |
| Bollinger %B / ATR | 31% / 0.01 |
| Support / Resistance 20 days | 0.62 / 0.63 |
| Data as of | 8 October 2026 16:04 WIB |
Disclaimer: This technical analysis is generated automatically from exchange data (via Yahoo Finance) and indicators calculated by JournalArta, for information and education only. The verdict and the entry, target and stop-loss levels are not investment advice or a solicitation to buy or sell any security. Investment decisions and their risks rest solely with the reader.
Track Genting Singapore share price daily: live levels, support/resistance and our full Genting Singapore analysis history.