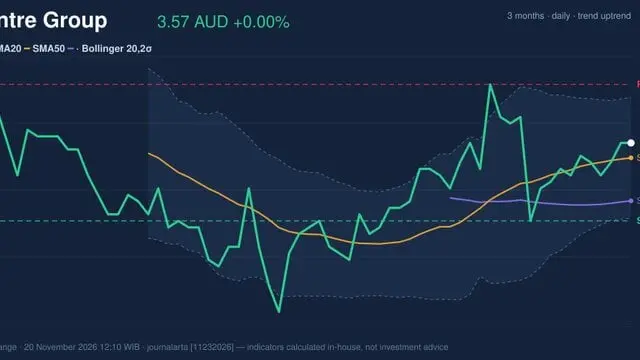
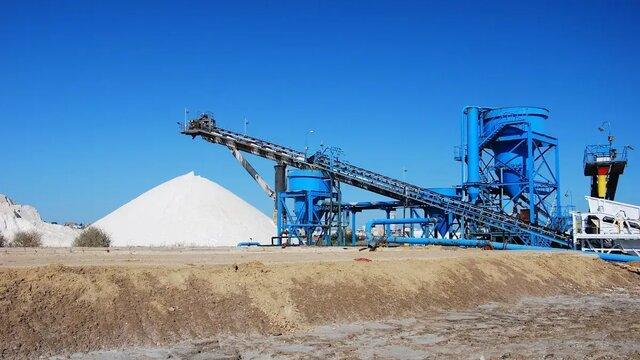
Whitehaven Coal Share Price Little Changed on Friday, Down 15.1% in a Month
Technical analysis of Whitehaven Coal stock on November 20, 2026: price 6.68 AUD, trend downtrend, RSI 32.1, support 6.68, resistance 7.98.

Why Whitehaven Coal is in focus today
- Volume at 0.0× the 20-day average
Selected automatically from 9 ASX (Australia) stocks by a technical-signal score with daily weighted randomisation — not a recommendation.
Trend & Price Action
A steep downtrend continues to dominate the asset's broader chart structure. The slope of the 20-day moving average dropped -3.45% over five days, signaling persistent overhead liquidation across consecutive sessions. Both short- and intermediate-term trendlines remain far above the current quote. The 20-day simple moving average tracks at 7.26 AUD, while the 50-day simple moving average sits at 7.53 AUD. The price trades firmly below both averages. There was no new moving average cross formed on the latest session. Whitehaven Coal now trades at 0% of its 20-day range, pinned between a 20-day support of 6.68 AUD and a 20-day resistance of 7.98 AUD.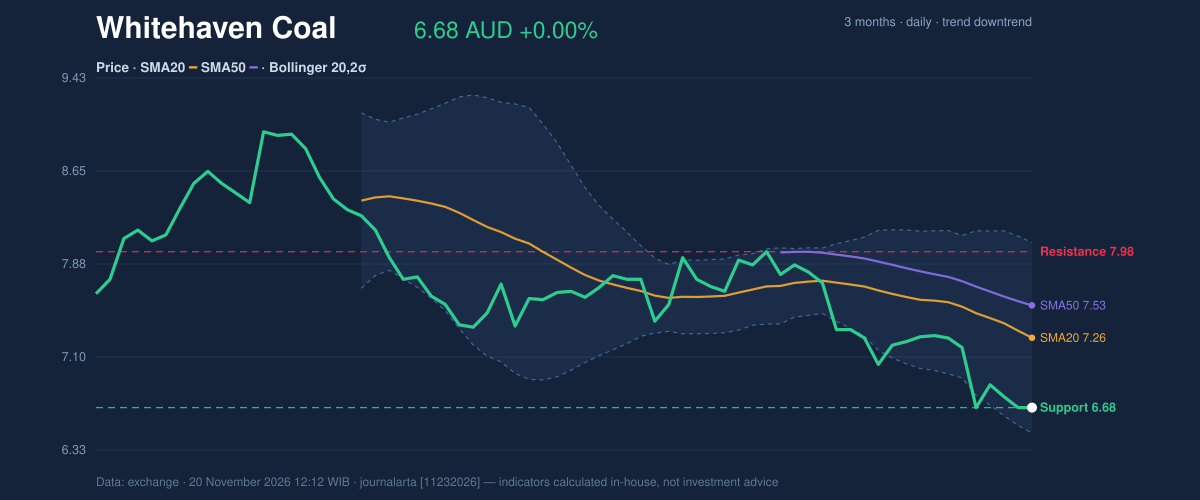
Oscillators & Momentum
Momentum indicators confirm entrenched weakness rather than an immediate speculative reversal. The 14-day Relative Strength Index registers at 32.1 (neutral), hovering just above the oversold boundary without producing positive divergence. The Moving Average Convergence Divergence indicator reflects persistent selling pressure. The MACD line stands at -0.256, trailing underneath the signal threshold of -0.198 to produce a negative histogram value of -0.057.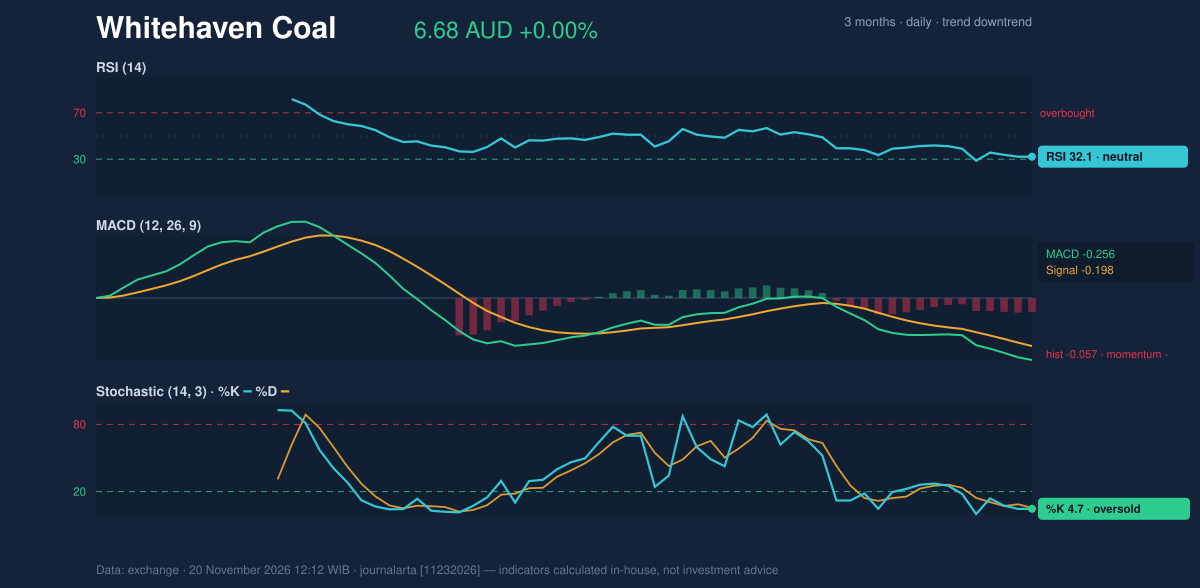
Volatility & Volume
Band indicators reflect expanding price dispersion across the Sydney market. The upper Bollinger Band sits at 8.06 AUD, the middle band aligns at 7.26 AUD, and the lower band rests at 6.47 AUD. The overall bandwidth stands at 21.9%, classified as widening alongside high volatility. A low %B reading of 13% shows the asset hugging its lower envelope. Price swings remain wide. The 14-day Average True Range reached 0.25 AUD, representing 3.7% of the share price to confirm high ongoing volatility. Exchange turnover totaled 7,217,202 shares, exceeding the 20-day average volume of 4,561,358 shares by 1.6 times. A falling On-Balance Volume confirmed that major participants were distributing shares as prices trended lower.Technical Verdict: SELL
The quantitative framework generates a clear SELL signal for Whitehaven Coal, carrying a model score of -68 on a -100 to +100 scale. Three primary structural factors justify this positioning: 1. Price trades below both its 20-day (7.26 AUD) and 50-day (7.53 AUD) moving averages within an active downtrend. 2. The 14-day RSI at 32.1 and a negative MACD histogram of -0.057 confirm sustained downward momentum. 3. A 1.6× volume surge alongside falling On-Balance Volume confirms institutional distribution rather than aggressive accumulation. Technical execution parameters are defined as follows: * Entry Range (Sell Zone): 6.68 AUD – 6.86 AUD * Exit Target 1: 6.04 AUD (reward/risk 1.5) * Exit Target 2: 5.39 AUD (reward/risk 3.0) * Stop Loss: 7.11 AUD * Validity: Open through 18 Dec 2026 The bearish thesis is invalidated if the price breaks above the 7.11 AUD stop-loss level. For general market observers, the data shows an asset where heavy trading volume continues to push prices lower beneath declining moving averages. The setup remains technically valid through December 18, 2026.Summary Data Whitehaven Coal
| Last price | 6.68 AUD |
| Change 1 day / 5 days / 1 month | 0.00% / -6.96% / -15.12% |
| Trend / MA-cross | downtrend / none |
| SMA20 / SMA50 | 7.26 / 7.53 |
| RSI (14) / Stochastic %K | 32.1 / 4.7 |
| Bollinger %B / ATR | 13% / 0.25 |
| Support / Resistance 20 days | 6.68 / 7.98 |
| Data as of | 20 November 2026 12:12 WIB |
| JournalArta research verdict (score) | Sell (-68) |
| Sell zone | 6.68 – 6.86 |
| Target 1 / 2 | 6.04 / 5.39 |
| Stop loss | 7.11 |
| Reward/risk | 1.5 / 3.0 |
Today's full Buy and Sell list for Australian stocks (ASX) →
Disclaimer: This technical analysis is generated automatically from exchange data and indicators calculated by JournalArta, for information and education only. The verdict and the entry, target and stop-loss levels are not investment advice or a solicitation to buy or sell any security. Investment decisions and their risks rest solely with the reader.
Track Whitehaven Coal share price daily: live levels, support/resistance and our full Whitehaven Coal analysis history.
 Take the quizWhat Kind of Holiday Spender Are You? Take the Black Friday QuizStart →





 Markets · FintechHow to Calculate Compound Interest: Formula, Examples and the Rule of 72
 Lifestyle · Food & HealthNormal Blood Pressure Chart by Age: Healthy Ranges Explained
 Lifestyle · Food & HealthWhat Is Raynaud’s Syndrome? Why Fingers Turn White in the Cold
 Lifestyle · Food & Health4 Ways Walking After Meals Helps Your Body, Doctors Say