Macquarie Share Price Latest: Little Changed on Friday, Down 10.8% in a Month
Technical analysis of Macquarie stock on November 20, 2026: price 220.03 AUD, trend downtrend, RSI 24.0, support 220.03, resistance 258.40.

Why Macquarie is in focus today
- Volume at 0.0× the 20-day average
Selected automatically from 9 ASX (Australia) stocks by a technical-signal score with daily weighted randomisation — not a recommendation.
Trend & Price Action
A pronounced downtrend defines the technical structure as the 20-day simple moving average fell 2.28% over five days. The 20-day average printed at 243.69 AUD, sitting just underneath the 50-day average of 245.05 AUD. A death cross confirmed negative momentum after the 20-day average crossed below the 50-day average one session prior to the latest trading day. Price sits entirely below both moving benchmarks.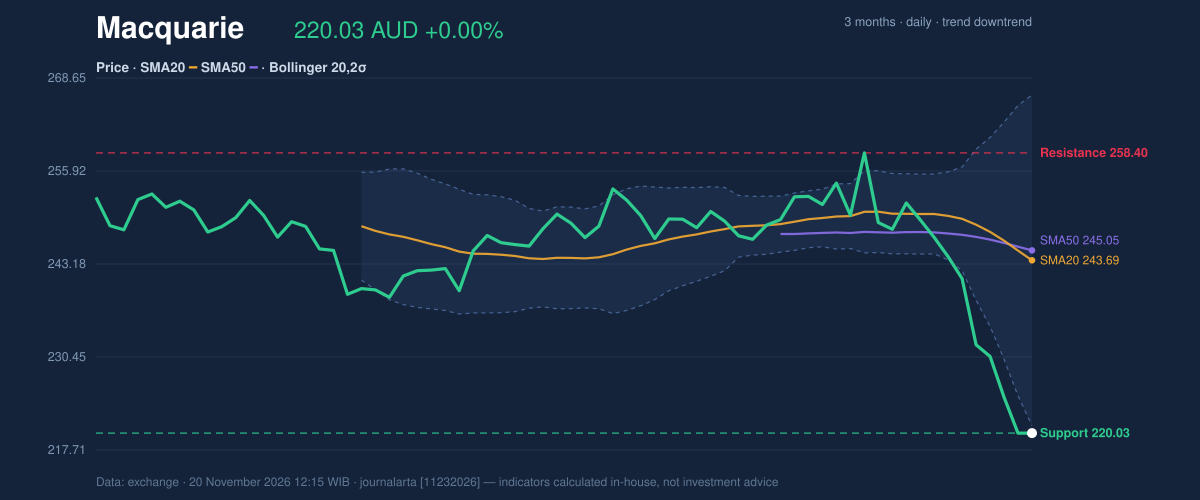
Oscillators & Momentum
Momentum indicators point to deeply stretched selling conditions across multiple horizons. The 14-day relative strength index slid to 24.0 (oversold), while the stochastic oscillator printed identical %K and %D readings of 0.0. These values confirm severe downside pressure without showing a turn.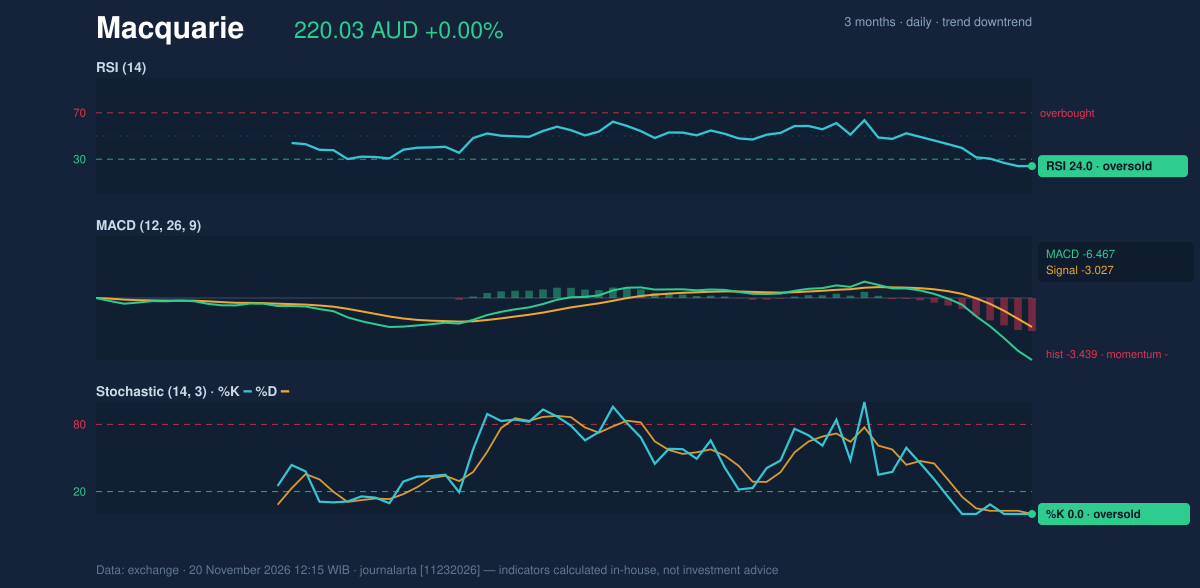
Key Levels & Scenarios
The immediate floor sits at the 20-day support of 220.03 AUD, which coincides with the three-month low. Initial overhead resistance emerges at the 20-day ceiling of 258.40 AUD, matching the three-month high. An intermediate obstacle rests at the middle Bollinger band of 243.69 AUD. If sellers push trading below 220.03 AUD, price discovery will extend into unchartered lower territory. A sustained technical rebound requires reclaiming the lower band at 221.05 AUD to pause the slide.Technical Verdict: SELL
JournalArta's model assigns a score of -74 on a scale of -100 to +100, prompting a firm SELL bias. The position reflects zero bullish indicators against three active bearish triggers: a recent death cross, a close below the lower Bollinger band, and declining cumulative volume. - Entry (Sell Zone): 220.03 – 224.74 AUD - Target Price 1: 203.98 AUD - Target Price 2: 187.93 AUD - Stop Loss: 230.73 AUD The setup invalidates if price breaks above 230.73 AUD. Severe technical deterioration keeps downward pressure dominant despite deeply oversold readings. These levels remain valid until 18 Dec 2026.Summary Data Macquarie
| Last price | 220.03 AUD |
| Change 1 day / 5 days / 1 month | 0.00% / -8.77% / -10.76% |
| Trend / MA-cross | downtrend / death |
| SMA20 / SMA50 | 243.69 / 245.05 |
| RSI (14) / Stochastic %K | 24.0 / 0.0 |
| Bollinger %B / ATR | -2% / 6.29 |
| Support / Resistance 20 days | 220.03 / 258.40 |
| Data as of | 20 November 2026 12:15 WIB |
| JournalArta research verdict (score) | Sell (-74) |
| Sell zone | 220.03 – 224.74 |
| Target 1 / 2 | 203.98 / 187.93 |
| Stop loss | 230.73 |
| Reward/risk | 1.5 / 3.0 |
Today's full Buy and Sell list for Australian stocks (ASX) →
Disclaimer: This technical analysis is generated automatically from exchange data and indicators calculated by JournalArta, for information and education only. The verdict and the entry, target and stop-loss levels are not investment advice or a solicitation to buy or sell any security. Investment decisions and their risks rest solely with the reader.
Track Macquarie share price daily: live levels, support/resistance and our full Macquarie analysis history.
 Take the quizWhat Kind of Holiday Spender Are You? Take the Black Friday QuizStart →





 Markets · FintechHow to Calculate Compound Interest: Formula, Examples and the Rule of 72
 Lifestyle · Food & HealthNormal Blood Pressure Chart by Age: Healthy Ranges Explained
 Lifestyle · Food & HealthWhat Is Raynaud’s Syndrome? Why Fingers Turn White in the Cold
 Lifestyle · Food & Health4 Ways Walking After Meals Helps Your Body, Doctors Say