Scentre Share Price Little Changed on Friday, Up 1.1% in a Month
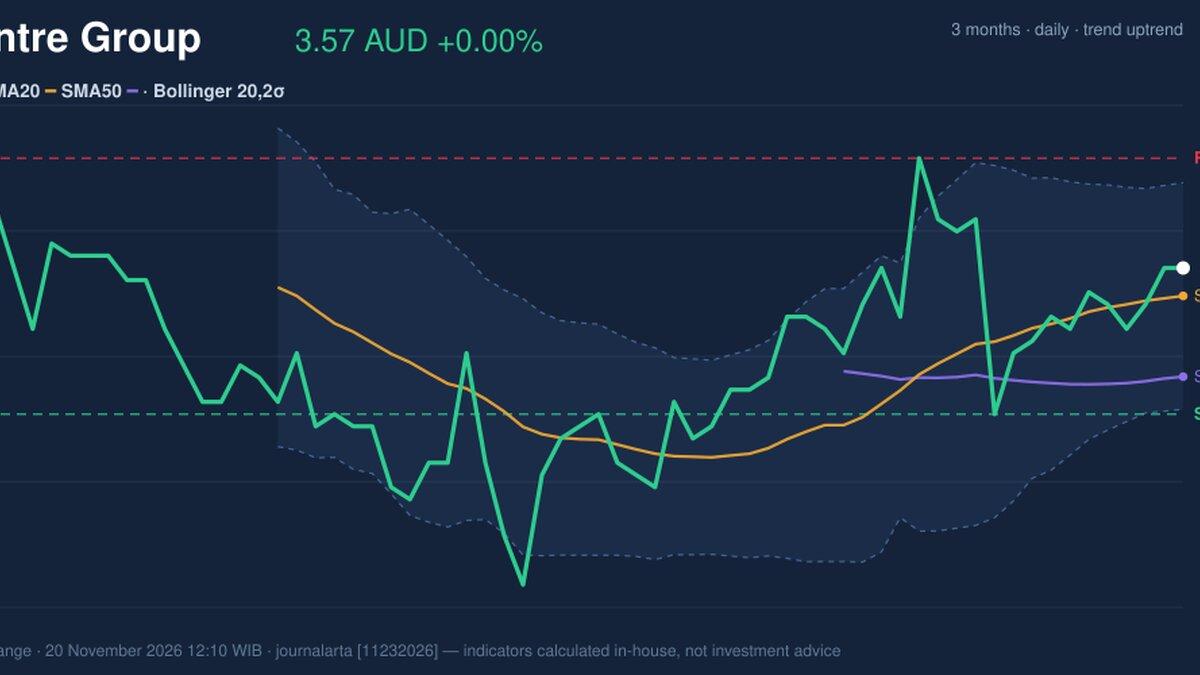
Technical analysis of Scentre Group stock on November 20, 2026: price 3.57 AUD, trend uptrend, RSI 55.5, support 3.45, resistance 3.66.
Why Scentre Group is in focus today
Selected automatically from 9 ASX (Australia) stocks by a technical-signal score with daily weighted randomisation — not a recommendation.
Trend & Price Action
The property giant trades in an active uptrend, positioned above its 20-day moving average of 3.55 AUD and its 50-day moving average of 3.48 AUD. Price holds above key baselines. The 20-day average rose 0.37% over five days, pointing to slow structural accumulation without a fresh moving average crossover on the session.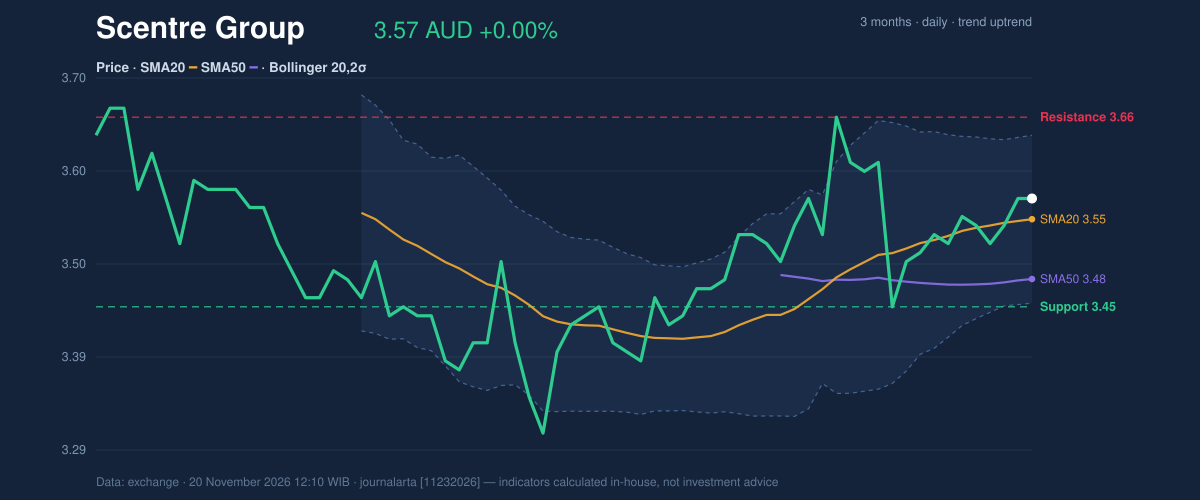
Oscillators & Momentum
Momentum indicators point to steady consolidation rather than speculative exhaustion. The 14-day relative strength index printed at 55.5, keeping conditions neutral. The Stochastic oscillator mirrors that stance, with %K at 59.3 crossing marginally over %D at 55.6.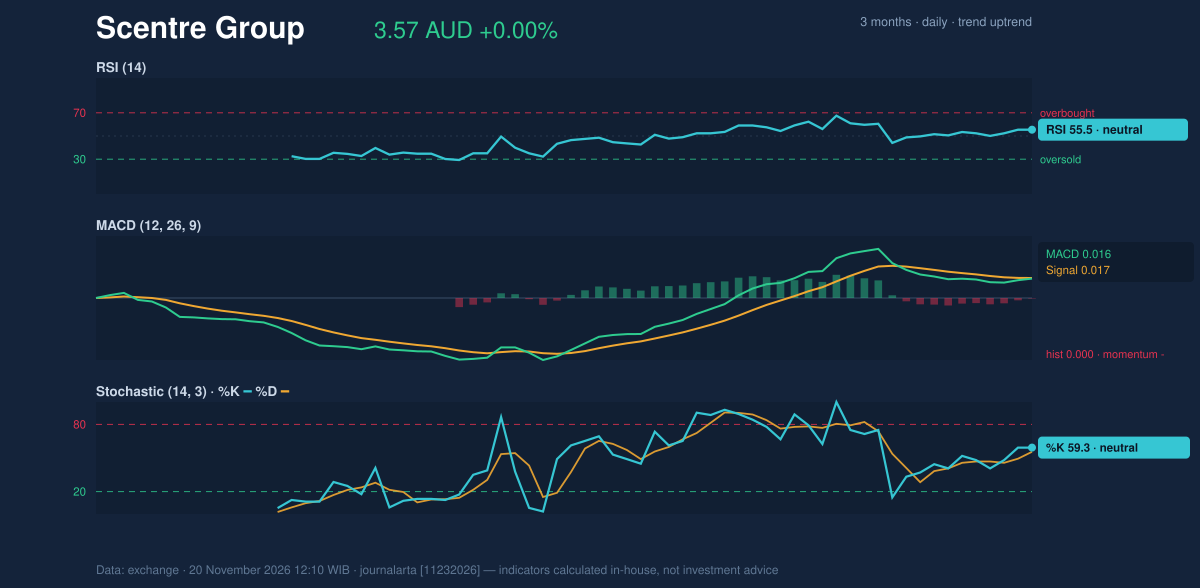
Volatility & Volume
Bollinger bands reveal a distinct compression. The upper band rests at 3.64 AUD, the middle line sits at 3.55 AUD, and the lower band holds at 3.45 AUD. The band width measures 5.2%. With %B recording 62%, the metric reflects a Bollinger squeeze that signals potential for a directional breakout once price expands away from the mean. Trading participation supported the move. Volume reached 14,717,870 shares, outpacing the 20-day mean of 11,276,828 shares by 1.3 times as on-balance volume climbed. The 14-day average true range finished at 0.07 AUD, representing 2.1% of the share price to indicate moderate daily volatility across recent sessions.Key Levels & Scenarios
Near-term support aligns with the 20-day trough at 3.45 AUD, matching the lower Bollinger boundary and resting just below the 50-day average of 3.48 AUD. Resistance stands at 3.66 AUD. A decisive push past that threshold exposes the three-month high of 3.70 AUD, while dropping beneath 3.45 AUD risks testing deeper structural demand.Technical Verdict: BUY
JournalArta's algorithmic model scores Scentre Group at +84 on its -100 to +100 scale, maintaining a technical BUY call based on two bullish signals against zero bearish factors. * Uptrend confirmation: Price holds above its 50-day average of 3.48 AUD alongside a rising on-balance volume profile and heavy trading turnover. * Moving average alignment: The 20-day average sits above the 50-day average, showing an intact pullback to the 20-day baseline within a broader primary advance. * Volatility setup: A tightening 5.2% Bollinger band width flags an impending volatility expansion from constructive consolidation levels. * Invalidation: The technical setup is invalidated if price breaks below 3.43 AUD, which would breach the lower envelope and recent cycle floors. * Entry zone: 3.52 AUD – 3.57 AUD * Target 1: 3.78 AUD (reward/risk 1.5) * Target 2: 3.99 AUD (reward/risk 3.0) * Stop loss: 3.43 AUD Scentre Group remains in a confirmed uptrend supported by solid turnover and tight price compression, favoring upside continuation while trading remains above trailing moving averages. For market participants, the setup reflects an orderly holding pattern where buyers defend moving averages ahead of an expected volatility breakout. The technical evaluation remains valid through December 18, 2026.Summary Data Scentre Group
| Last price | 3.57 AUD |
| Change 1 day / 5 days / 1 month | 0.00% / 0.56% / 1.13% |
| Trend / MA-cross | uptrend / none |
| SMA20 / SMA50 | 3.55 / 3.48 |
| RSI (14) / Stochastic %K | 55.5 / 59.3 |
| Bollinger %B / ATR | 62% / 0.07 |
| Support / Resistance 20 days | 3.45 / 3.66 |
| Data as of | 20 November 2026 12:10 WIB |
| JournalArta research verdict (score) | Buy (+84) |
| Entry zone | 3.52 – 3.57 |
| Target 1 / 2 | 3.78 / 3.99 |
| Stop loss | 3.43 |
| Reward/risk | 1.5 / 3.0 |
Today's full Buy and Sell list for Australian stocks (ASX) →
Disclaimer: This technical analysis is generated automatically from exchange data and indicators calculated by JournalArta, for information and education only. The verdict and the entry, target and stop-loss levels are not investment advice or a solicitation to buy or sell any security. Investment decisions and their risks rest solely with the reader.
Track Scentre Group share price daily: live levels, support/resistance and our full Scentre Group analysis history.
 Take the quizWhat Kind of Holiday Spender Are You? Take the Black Friday QuizStart →





 Markets · FintechHow to Calculate Compound Interest: Formula, Examples and the Rule of 72
 Lifestyle · Food & HealthNormal Blood Pressure Chart by Age: Healthy Ranges Explained
 Lifestyle · Food & HealthWhat Is Raynaud’s Syndrome? Why Fingers Turn White in the Cold
 Lifestyle · Food & Health4 Ways Walking After Meals Helps Your Body, Doctors Say