Qantas Airways Share Price Little Changed on Friday, Up 14.8% in a Month
Technical analysis of Qantas stock on November 20, 2026: price 9.64 AUD, trend uptrend, RSI 59.3, support 8.65, resistance 9.96.

Why Qantas is in focus today
Selected automatically from 9 ASX (Australia) stocks by a technical-signal score with daily weighted randomisation — not a recommendation.
Trend & Price Action
Market data shows the airline sustaining an established uptrend above key dynamic baselines. The 20-day moving average rose 3.40% over five days to reach 9.36 AUD. That baseline sits comfortably above the 50-day moving average at 8.96 AUD. Prices held firm above both averages during the session. No fresh moving average cross formed. As shown in the chart below, current price action places the equity at 76% of its 20-day trading span between support and resistance.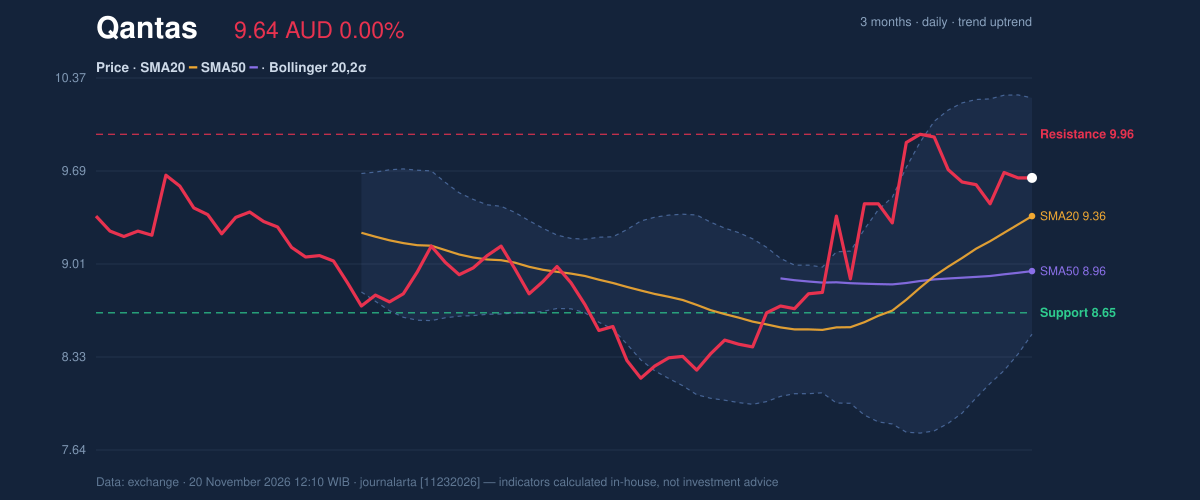
Oscillators & Momentum
Momentum indicators point to steady buying pressure without immediate signs of exhaustion. The 14-day Relative Strength Index printed at 59.3 in neutral territory. The reading sits comfortably beneath traditional overbought boundaries. The Moving Average Convergence Divergence line posted 0.237 against a signal line of 0.232. That configuration leaves the MACD histogram slightly positive at 0.005. The Stochastic oscillator recorded %K at 64.3 alongside %D at 67.5, maintaining a neutral posture.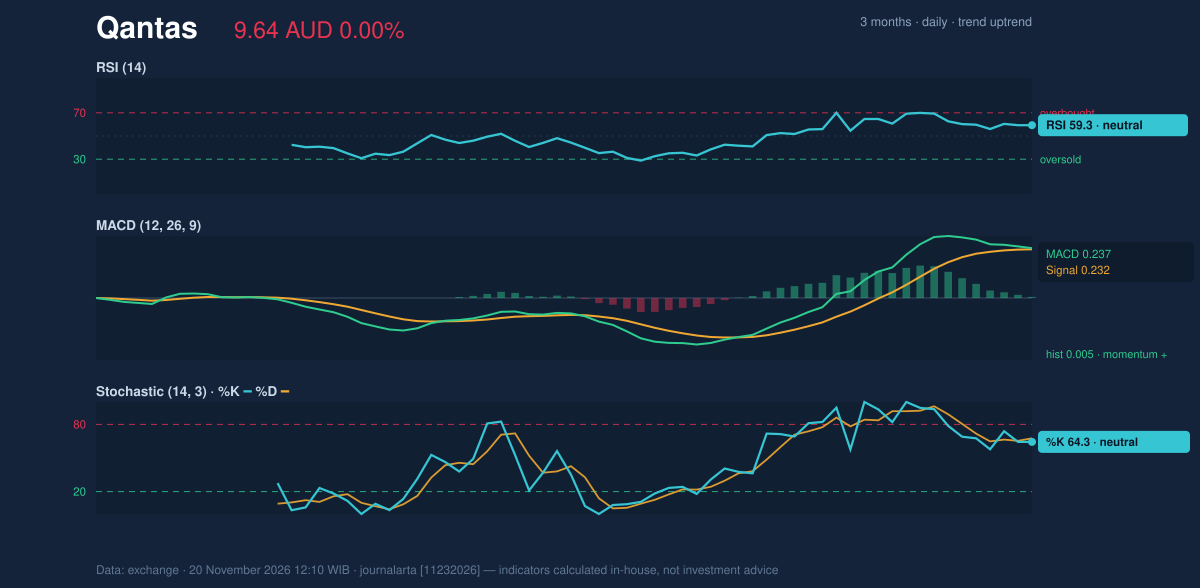
Volatility & Volume
Bollinger bands reflect stable trading boundaries with bandwidth measured at 18.5%. The upper band rests at 10.23 AUD, the middle line aligns with the 20-day average at 9.36 AUD, and the lower band sits at 8.49 AUD. The %B metric registered 66%, showing the stock trading in the upper half of its volatility envelope. Average True Range settled at 0.27 AUD, representing 2.8% of the share price. Turnover contracted noticeably during the session. Volume reached 4,139,744 shares, well below the 20-day average of 6,544,858 shares. On-Balance Volume ticked lower alongside the thinner activity.Key Levels & Scenarios
Near-term boundaries remain clearly defined by historical price interaction. A decisive climb above 9.96 AUD would open a path toward the three-month ceiling at 10.05 AUD. Sustained buying could push valuations toward the upper Bollinger barrier at 10.23 AUD. The baseline support at 8.65 AUD shields the longer-term advance. A dip beneath the 50-day benchmark at 8.96 AUD would signal a deeper structural pause.Technical Verdict: BUY
JournalArta's algorithmic model rates Qantas Airways as a BUY with an aggregate score of +76 on a scale from −100 to +100. The positive rating is supported by three primary technical factors: - The equity trades above its rising 50-day simple moving average. - The 20-day moving average maintains its position above the 50-day average within a broader uptrend. - The 14-day RSI of 59.3 remains within the constructive 50–70 expansion zone. The technical setup is invalidated if the share price breaks below the stop level at 9.17 AUD. Execution parameters derived from current market structure: - Entry Zone: 9.44 – 9.64 AUD - Target Price 1: 10.34 AUD - Target Price 2: 11.05 AUD - Stop Loss: 9.17 AUD - Reward/Risk Ratio: 1.5 / 3.0 The technical structure indicates steady upward momentum with favorable price positioning above dynamic supports. The parameters remain valid through December 18, 2026.Summary Data Qantas
| Last price | 9.64 AUD |
| Change 1 day / 5 days / 1 month | 0.00% / 0.31% / 14.76% |
| Trend / MA-cross | uptrend / none |
| SMA20 / SMA50 | 9.36 / 8.96 |
| RSI (14) / Stochastic %K | 59.3 / 64.3 |
| Bollinger %B / ATR | 66% / 0.27 |
| Support / Resistance 20 days | 8.65 / 9.96 |
| Data as of | 20 November 2026 12:10 WIB |
| JournalArta research verdict (score) | Buy (+76) |
| Entry zone | 9.44 – 9.64 |
| Target 1 / 2 | 10.34 / 11.05 |
| Stop loss | 9.17 |
| Reward/risk | 1.5 / 3.0 |
Today's full Buy and Sell list for Australian stocks (ASX) →
Disclaimer: This technical analysis is generated automatically from exchange data and indicators calculated by JournalArta, for information and education only. The verdict and the entry, target and stop-loss levels are not investment advice or a solicitation to buy or sell any security. Investment decisions and their risks rest solely with the reader.
Track Qantas share price daily: live levels, support/resistance and our full Qantas analysis history.
 Take the quizWhat Kind of Holiday Spender Are You? Take the Black Friday QuizStart →





 Markets · FintechHow to Calculate Compound Interest: Formula, Examples and the Rule of 72
 Lifestyle · Food & HealthNormal Blood Pressure Chart by Age: Healthy Ranges Explained
 Lifestyle · Food & HealthWhat Is Raynaud’s Syndrome? Why Fingers Turn White in the Cold
 Lifestyle · Food & Health4 Ways Walking After Meals Helps Your Body, Doctors Say