CSL Share Price Little Changed (November 20, 2026): Trading Volume 1.5x Normal
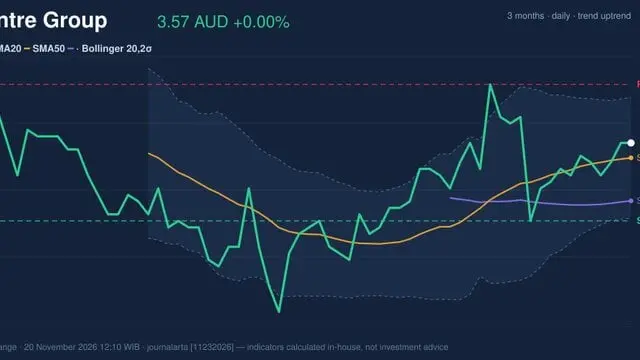
Technical analysis of CSL stock on November 20, 2026: price 197.29 AUD, trend sideways, RSI 51.2, support 196.78, resistance 204.54.
Why CSL is in focus today
- Volume at 0.0× the 20-day average
Selected automatically from 9 ASX (Australia) stocks by a technical-signal score with daily weighted randomisation — not a recommendation.
Trend & Price Action
CSL trades below its 20-day moving average of 200.01 AUD, though it remains above its 50-day average of 190.18 AUD. The 20-day average rose 0.33% over five days, keeping the intermediate baseline constructive despite short-term slippage. No new moving-average cross formed during the session.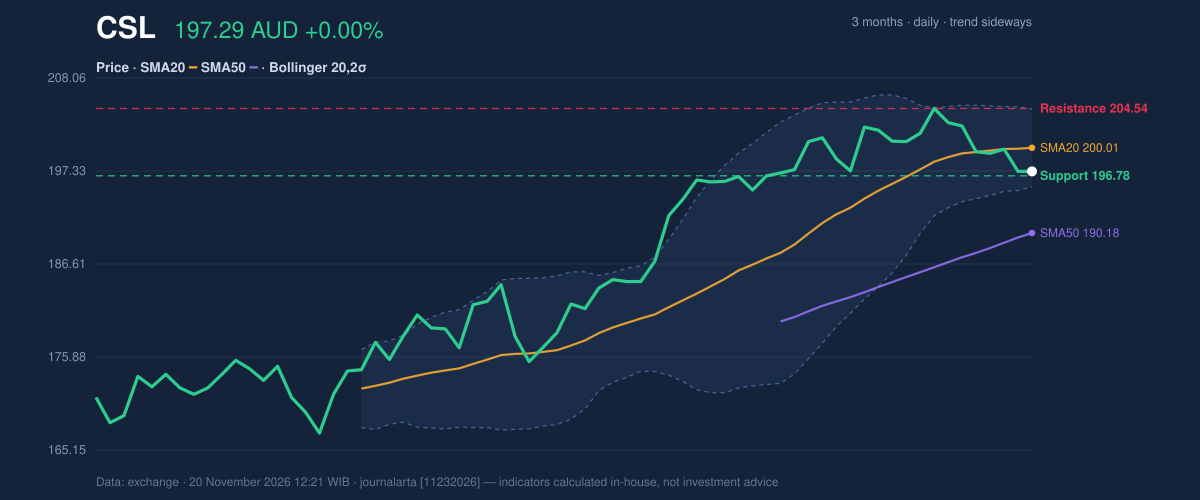
Oscillators & Momentum
The 14-day relative strength index reads 51.2, marking a neutral stance after rolling over from above 65. Stochastics reflect cautious positioning, with %K at 25.0 and %D at 31.3.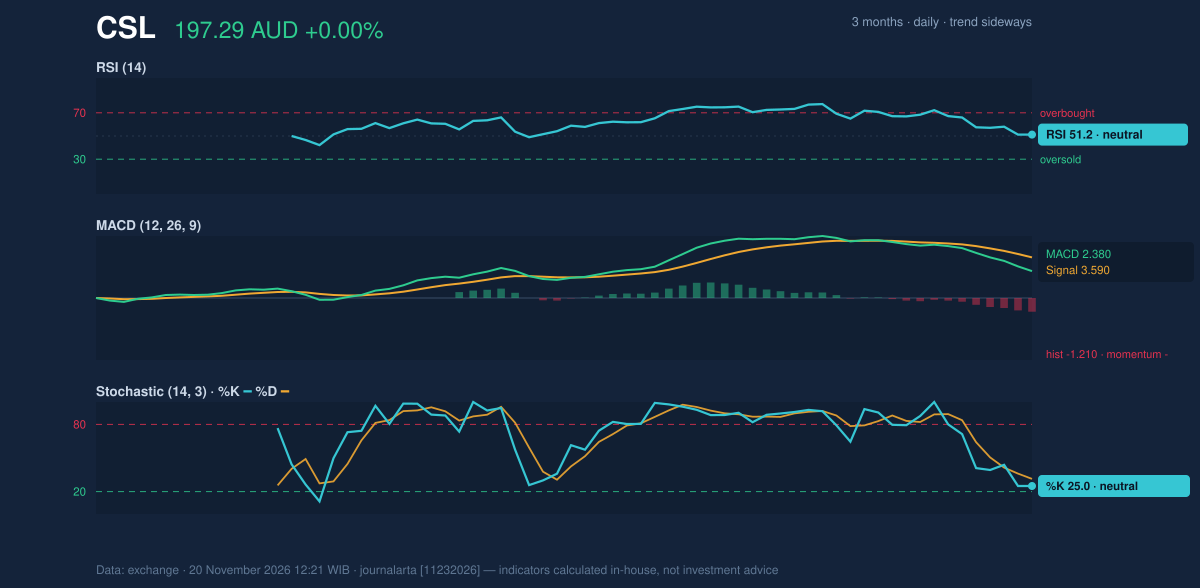
Volatility & Volume Distribution
Bollinger bands have narrowed significantly to a width of 4.5%, signaling a classic volatility squeeze that often precedes an expansive price breakout. The upper band rests at 204.49 AUD, while the lower band sits at 195.54 AUD, leaving %B compressed at 20%. Average true range stands at 3.77 AUD, representing moderate volatility of 1.9% relative to price. Meanwhile, on-balance volume edged lower, indicating steady distribution into Friday's heavy volume.Key Levels & Breakout Scenarios
A decisive push above the 20-day resistance at 204.54 AUD would target the 3-month high of 205.48 AUD. Conversely, a failure to defend 20-day support at 196.78 AUD exposes the volatility-adjusted floor at 191.63 AUD. Buyers must prove their commitment.Technical Verdict: HOLD (wait & see)
The JournalArta technical score registers +48 on a -100 to +100 scale, warranting a firm HOLD (wait & see) stance until trend and momentum align. Key technical drivers include: - Intermediate strength persists as price holds above the 50-day average, alongside the 20-day average trading over the 50-day benchmark. - Momentum remains conflicted, with RSI(14) at 51.2 rolling over while the MACD histogram prints a negative -1.210 reading. - Volatility is compressed inside a 4.5% Bollinger squeeze, while on-balance volume declined during Friday's volume surge. The neutral thesis is invalidated if the price closes below 20-day support at 196.78 AUD or decisively clears 20-day resistance at 204.54 AUD. Conditional scenario parameters: - Ideal Entry Range: 196.78 AUD to 197.29 AUD (or a breakout entry above 204.54 AUD) - Exit Target (Target Price): 202.95 AUD to 204.54 AUD (secondary target at 205.48 AUD) - Stop Loss Protection: 195.54 AUD (or 191.63 AUD for broader breakout room) For everyday investors, the stock is taking a pause near support, making it smarter to observe the next directional breakout rather than chasing the current consolidation. ASX market participants now await the Monday opening bell to see whether buyers defend the 196.78 AUD floor under normal liquidity conditions.Summary Data CSL
| Last price | 197.29 AUD |
| Change 1 day / 5 days / 1 month | 0.00% / -2.58% / 1.10% |
| Trend / MA-cross | sideways / none |
| SMA20 / SMA50 | 200.01 / 190.18 |
| RSI (14) / Stochastic %K | 51.2 / 25.0 |
| Bollinger %B / ATR | 20% / 3.77 |
| Support / Resistance 20 days | 196.78 / 204.54 |
| Data as of | 20 November 2026 12:21 WIB |
| JournalArta research verdict (score) | Hold (+48) |
Today's full Buy and Sell list for Australian stocks (ASX) →
Disclaimer: This technical analysis is generated automatically from exchange data and indicators calculated by JournalArta, for information and education only. The verdict and the entry, target and stop-loss levels are not investment advice or a solicitation to buy or sell any security. Investment decisions and their risks rest solely with the reader.
Track CSL share price daily: live levels, support/resistance and our full CSL analysis history.
 Take the quizWhat Kind of Holiday Spender Are You? Take the Black Friday QuizStart →





 Markets · FintechHow to Calculate Compound Interest: Formula, Examples and the Rule of 72
 Lifestyle · Food & HealthNormal Blood Pressure Chart by Age: Healthy Ranges Explained
 Lifestyle · Food & HealthWhat Is Raynaud’s Syndrome? Why Fingers Turn White in the Cold
 Lifestyle · Food & Health4 Ways Walking After Meals Helps Your Body, Doctors Say