Advanced Micro Devices (AMD) Stock Update: Tumbles 7.72%, Trading Volume 1.8x Normal
Technical analysis of AMD stock on November 19, 2026: price 489.19 USD, trend downtrend, RSI 45.2, support 404.40, resistance 585.30.

Why AMD is in focus today
- One-day move of 0.00%, about 0.0× its average daily range (ATR)
- Volume at 0.0× the 20-day average
Selected automatically from 11 NASDAQ (US) stocks by a technical-signal score with daily weighted randomisation — not a recommendation.
Trend & Price Action
The stock is trading below its 20-day moving average of 513.70 USD and well under its 50-day average of 554.93 USD, a stacked alignment that defines a downtrend rather than a dip. The 20-day average itself is falling, down 0.97% over five days — a slope, not a price change, telling readers that the short-term benchmark is still bending downward. No fresh moving-average cross has formed, meaning the positioning was already bearish before this week. The decline is a continuation, not a new signal.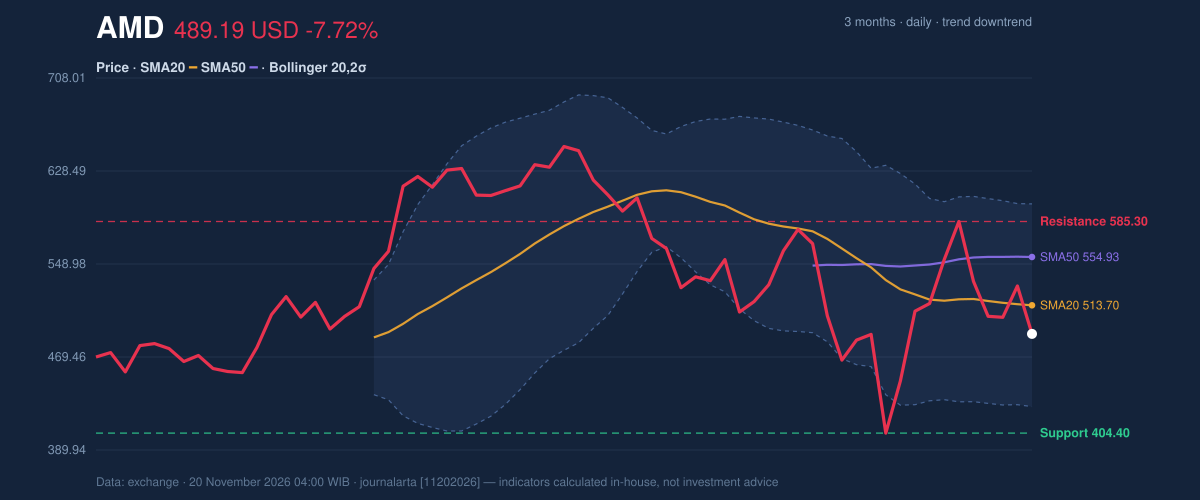
Oscillators & Momentum
The momentum readings are curiously calm for a stock that just fell 7.72%. RSI(14) reads 45.2, squarely in neutral territory, neither oversold nor showing the exhaustion that typically precedes a bounce. Stochastic is similarly non-committal at %K 45.4 against %D 55.0, with the faster line below the slower one — mild downward pressure without a decisive signal.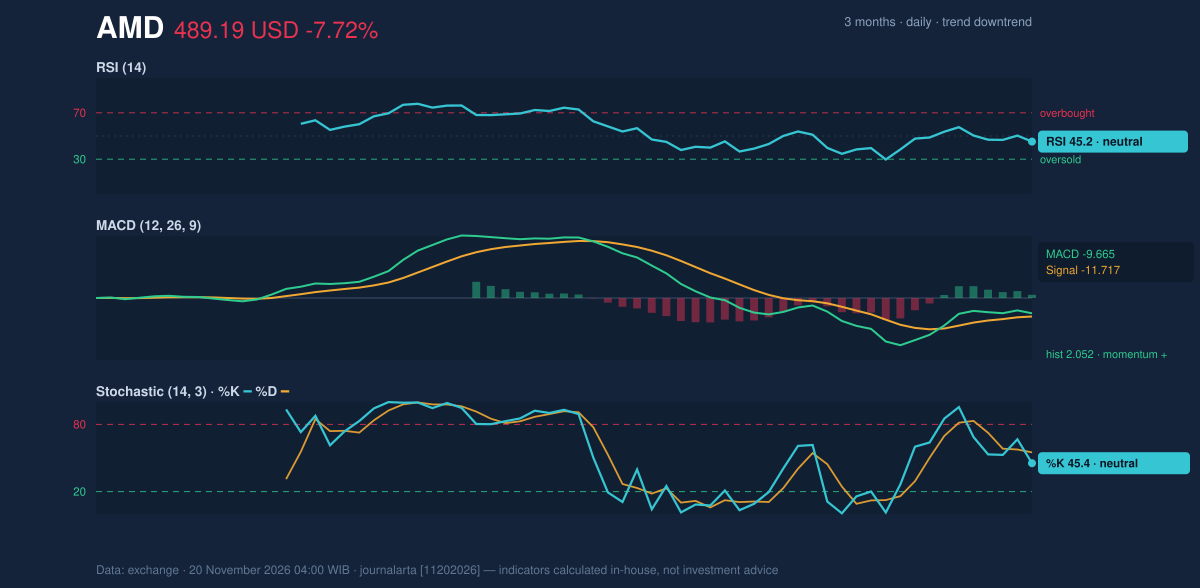
Volatility & Volume
Bollinger bands are 33.7% wide and expanding, with the upper band at 600.35 USD and lower at 427.05 USD. %B at 36% places price in the lower third of the envelope — closer to the floor than the ceiling, though not pinned to it. The average true range of 50.89 USD, or 10.4% of the price, confirms this is a high-volatility name where daily swings of this size are within normal behaviour rather than a shock. Volume is the loudest signal. The latest session traded 71.1 million shares against a 20-day average of 39.6 million — a 1.8× surge — and it came on a down day. Heavy selling volume is participation confirming the move, not a thin-market accident. Yet On-Balance Volume is rising, a divergence suggesting cumulative distribution has not fully taken hold.Key Levels & Scenarios
The actionable boundaries are clear. A close above 585.30 USD — the 20-day resistance, which also sits near the reference level of 565.53 USD derived from price plus 1.5×ATR — would mark the first credible challenge to the downtrend. Conversely, a break of 404.40 USD support would open the path toward the three-month low at 402.10 USD, with the 412.85 USD level (price minus 1.5×ATR) as the intervening checkpoint.Fundamental Context
The company’s own numbers remain robust: net income of $2.43 billion for the quarter versus $1.24 billion a year earlier, and diluted earnings per share of $1.46, according to its SEC filing. That is the tension investors are pricing — a business compounding, a stock de-rating.Technical Verdict: HOLD (wait & see)
The call is HOLD (wait & see), with a computed score of −73 on a −100 to +100 scale, driven by price below the 50-day average, a falling 20-day average, RSI in the 30–50 zone, a five-day drop of 16.42%, and volume 1.8× average on a down day. The stop required by current volatility would sit too far from price to justify a directional position.- Upside scenario: entry considered only on a close above the 20-day resistance at 585.30 USD; target toward the three-month high of 658.52 USD.
- Downside scenario: a break of 404.40 USD support targets the three-month low at 402.10 USD; the 412.85 USD level acts as an intermediate checkpoint.
- Stop protection: below 402.10 USD for any long-side setup.
Summary Data AMD
| Last price | 489.19 USD |
| Change 1 day / 5 days / 1 month | -7.72% / -16.42% / -3.69% |
| Trend / MA-cross | downtrend / none |
| SMA20 / SMA50 | 513.70 / 554.93 |
| RSI (14) / Stochastic %K | 45.2 / 45.4 |
| Bollinger %B / ATR | 36% / 50.89 |
| Support / Resistance 20 days | 404.40 / 585.30 |
| Data as of | 20 November 2026 04:00 WIB |
| JournalArta research verdict (score) | Hold (-73) |
Today's full Buy and Sell list for US stocks →
Disclaimer: This technical analysis is generated automatically from exchange data and indicators calculated by JournalArta, for information and education only. The verdict and the entry, target and stop-loss levels are not investment advice or a solicitation to buy or sell any security. Investment decisions and their risks rest solely with the reader.
Track AMD stock price daily: live levels, support/resistance and our full AMD analysis history.
 Take the quizWhat Kind of Holiday Spender Are You? Take the Black Friday QuizStart →





 Lifestyle · Food & HealthNormal Blood Pressure Chart by Age: Healthy Ranges Explained
 Lifestyle · Food & HealthWhat Is Raynaud’s Syndrome? Why Fingers Turn White in the Cold
 Lifestyle · Food & Health4 Ways Walking After Meals Helps Your Body, Doctors Say
 Lifestyle · Food & Health4 Reasons to Eat Oatmeal, According to Nutrition Experts