Lululemon Athletica (LULU) Stock Latest: Slides 4.74% on Thursday, Up 1% in Five Sessions
Technical analysis of LULU stock on November 19, 2026: price 105.53 USD, trend sideways, RSI 50.0, support 99.01, resistance 112.53.

Why LULU is in focus today
- One-day move of 0.00%, about 0.0× its average daily range (ATR)
Selected automatically from 11 NASDAQ (US) stocks by a technical-signal score with daily weighted randomisation — not a recommendation.
Trend & Price Action
The moving-average structure still favors the bulls. The 20-day average sits at $107.23, above the 50-day at $101.46, and the 20-day has been rising 1.72% over the past five sessions — the footprint of an uptrend that has not broken. But the last price of $105.53 is back below the 20-day average, which is the immediate problem: short-term holders are underwater and the stock is testing whether this is a routine rest stop or the start of something deeper. No new moving-average cross has formed, so neither a golden nor a death cross is in play. Zoom out and the frame widens. The three-month high of $124.47 and low of $90.38 put the current price in the middle of a wide band — a market that has neither confirmed a new leg up nor surrendered the recovery from the lows. Bollinger bands, at $100.34 to $114.12 around a $107.23 midpoint, are of normal width at 12.9%, so there is room for the price to travel without the bands forcing a decision.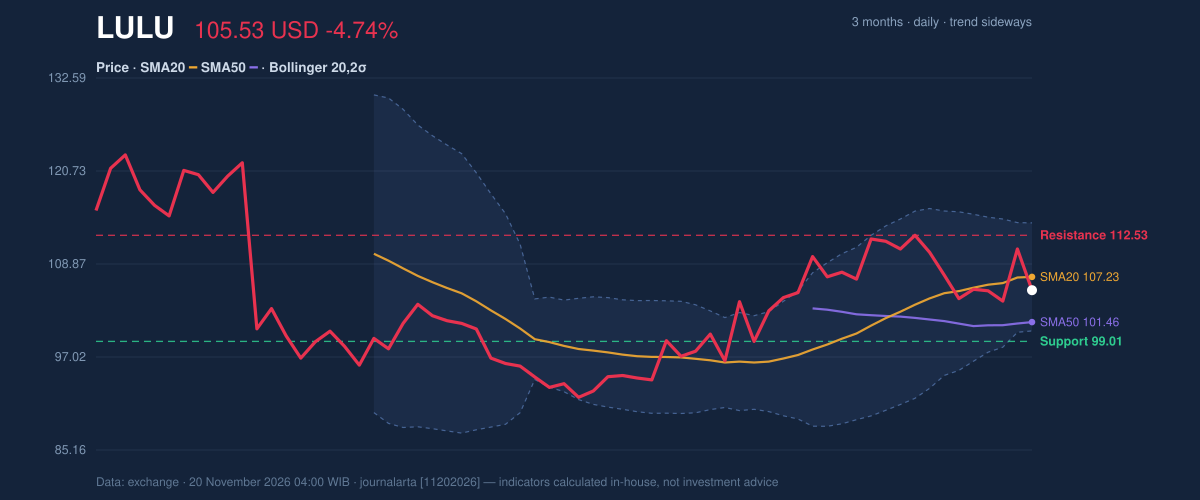
Oscillators & Momentum
Momentum is the weak link, and it is precisely where the story gets interesting. RSI(14) at 50.0 is dead neutral — no oversold bounce signal, no overbought exhaustion. That flat reading is consistent with a stock digesting a move, not one being dumped. The shorter-term gauges are more candid. Stochastic %K has slid to 19.9 against %D at 30.7, putting the fast line in oversold territory and beneath its signal line — a sign sellers have pressed hard enough that a tactical bounce becomes more likely than a further slide. MACD tells the opposite story: the line at 1.358 sits above zero but below its 1.815 signal, with a negative histogram of −0.457. Translation: the medium-term trend is still up, but the momentum behind it is fading. Divergence between an oversold stochastic and a negative MACD histogram is classic consolidation behavior — a stock cooling off, not collapsing.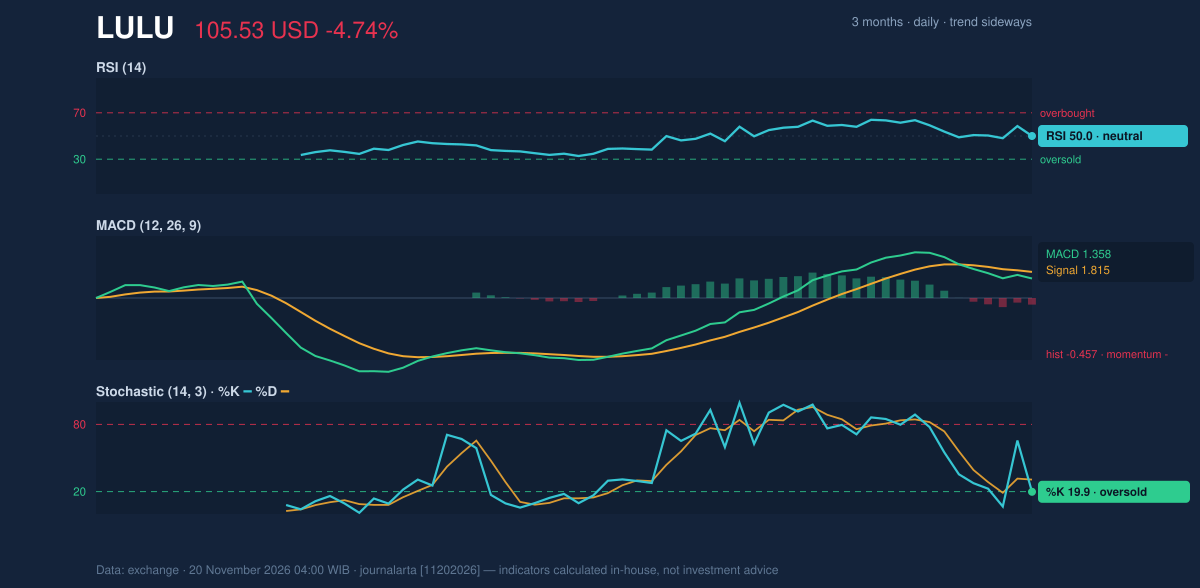
Volatility & Volume
ATR(14) of 4.69 equals 4.4% of the share price — high volatility for a large-cap consumer name, meaning a $4–5 swing in a session is normal and position sizing matters. On volume, the on-balance-volume line is falling, which flags distribution: sellers have been the more aggressive cohort even as the price holds its range. That is a caution, not a verdict — falling OBV alongside a stock still above its 50-day average often resolves with the price catching up to the volume, or the volume drying up as the price stabilizes.Key Levels & Scenarios
The line in the sand is $99.01, the 20-session support, which sits just under the lower Bollinger band at $100.34. If that floor breaks on expanding volume, the bullish structure of higher averages starts to erode. On the upside, $112.53 is the 20-session resistance, with the upper Bollinger band at $114.12 just beyond — a close above that zone would confirm the pullback was a pause in an intact uptrend. Watch the $107.23 midband as the pivot: reclaiming it would neutralize the current short-term weakness.Fundamental Context
The technical picture is being tested against a softer business backdrop. According to its SEC filing, Lululemon reported quarterly revenue of $2.42 billion for the quarter ended 2026-08-02, down 4.3% from $2.53 billion a year earlier, with net income of $329.2 million versus $370.9 million and diluted EPS of $2.92. That is a deceleration the market is pricing, and it explains why a stock above its 50-day average can still wobble on light volume.Technical Verdict: BUY
The code-driven JournalArta reading is BUY, with a score of +66 on a −100 to +100 scale, driven by price above the 50-day average, the 20-day average above the 50-day, and RSI in the neutral 50–70 zone. The strongest supporting evidence: the pullback to the 20-day average within an uptrend is a textbook bullish continuation setup, and the stochastic at 19.9 is oversold, offering a low-risk entry point. The main risk is the negative MACD histogram at −0.457 and falling OBV, which argue for patience rather than a chase. - Entry Range: $102.02 – $105.53 - Exit Target 1: $117.48 | Target 2: $129.44 - Stop Loss: $97.56 (reward/risk 1.5 / 3.0, valid until 18 Dec 2026) Verdict invalidated if price breaks below the $97.56 stop. For a non-trader: this is a stock that has drifted back to a comfortable resting point inside an uptrend, and the indicators suggest the buyers still have the longer-term edge — provided the $99 floor holds. *This is technical analysis based on exchange data and company filings, not an investment recommendation.*Summary Data LULU
| Last price | 105.53 USD |
| Change 1 day / 5 days / 1 month | -4.74% / 1.02% / 1.41% |
| Trend / MA-cross | sideways / none |
| SMA20 / SMA50 | 107.23 / 101.46 |
| RSI (14) / Stochastic %K | 50.0 / 19.9 |
| Bollinger %B / ATR | 38% / 4.69 |
| Support / Resistance 20 days | 99.01 / 112.53 |
| Data as of | 20 November 2026 04:00 WIB |
| JournalArta research verdict (score) | Buy (+66) |
| Entry zone | 102.02 – 105.53 |
| Target 1 / 2 | 117.48 / 129.44 |
| Stop loss | 97.56 |
| Reward/risk | 1.5 / 3.0 |
Today's full Buy and Sell list for US stocks →
Disclaimer: This technical analysis is generated automatically from exchange data and indicators calculated by JournalArta, for information and education only. The verdict and the entry, target and stop-loss levels are not investment advice or a solicitation to buy or sell any security. Investment decisions and their risks rest solely with the reader.
Track LULU stock price daily: live levels, support/resistance and our full LULU analysis history.
 Take the quizWhat Kind of Holiday Spender Are You? Take the Black Friday QuizStart →





 Lifestyle · Food & HealthNormal Blood Pressure Chart by Age: Healthy Ranges Explained
 Lifestyle · Food & HealthWhat Is Raynaud’s Syndrome? Why Fingers Turn White in the Cold
 Lifestyle · Food & Health4 Ways Walking After Meals Helps Your Body, Doctors Say
 Lifestyle · Food & Health4 Reasons to Eat Oatmeal, According to Nutrition Experts