Colgate-Palmolive (CL) Stock Falls 1.99% (November 19, 2026): Down 1% in Five Sessions
Technical analysis of CL stock on November 19, 2026: price 96.88 USD, trend uptrend, RSI 53.0, support 91.69, resistance 100.99.

Why CL is in focus today
Selected automatically from 11 NYSE (US) stocks by a technical-signal score with daily weighted randomisation — not a recommendation.
Trend & Price Action
The broader structure remains constructive. Colgate trades above both its 20-day average (96.72) and its 50-day average (91.83), and the 20-day sits above the 50-day, the classic arrangement of an uptrend. No new moving-average crossover has formed, so the trend signal is a continuation story rather than a fresh breakout. The stock also holds about 56% of its 20-day range between support at 91.69 and resistance at 100.99, and it sits in the upper half of its three-month band of 83.99 to 101.81. But the day's close is the tell: price is effectively touching, not bouncing decisively off, the 20-day line. The single bullish signal in the data set — a pullback to the 20-day average within an uptrend, with price above the 50-day — only completes if buyers step in here.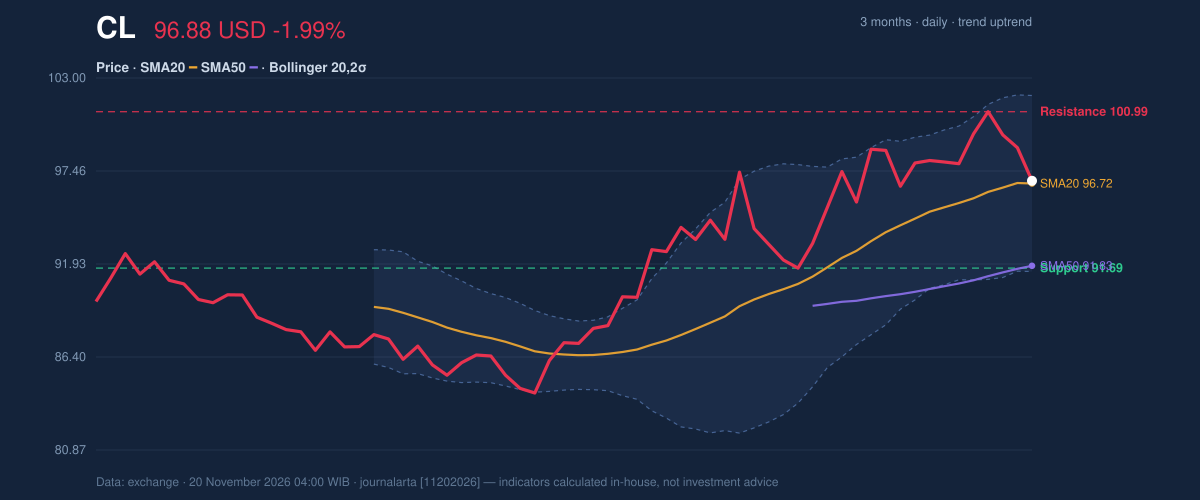
Oscillators & Momentum
Momentum is where the picture darkens. The MACD reads 1.949 against a signal line of 2.133, and the histogram at −0.184 has just turned negative — an early warning that upward momentum is fading even as the trend holds. The data records this as one of two bearish signals, the other being the 14-day RSI rolling over from above 65. It now sits at 53.0, a neutral reading that leaves room in either direction. The stochastic tells a subtler story: %K has dropped to 24.8 while %D holds at 53.6. That gap is a sharp short-term deceleration, but because the longer oscillator has not followed it down, the reading is classified as neutral rather than oversold. In plain terms, the stock has cooled fast without yet signalling a rebound.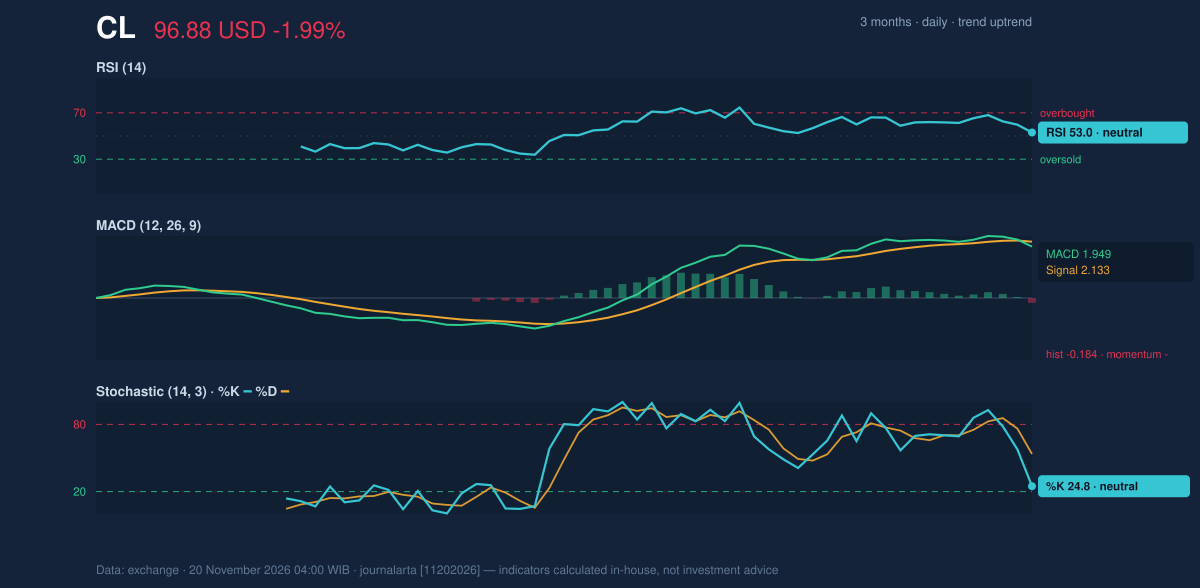
Volatility & Volume
Volatility is moderate. The 14-day ATR of 2.22 equals 2.3% of the share price, implying a normal daily range for a large-cap staple. Bollinger bands, at 101.96 above and 91.49 below, are neither squeezed nor stretched — the 10.8% width is normal — and the %B of 52% places price just above the middle of the envelope. There is room to move in either direction before conditions become stretched. The volume picture is more telling. The heavier session and the falling On-Balance Volume line suggest distribution — sellers using the slip to lighten positions — rather than accumulation on weakness. A pullback to support with rising OBV would read as healthy consolidation; the opposite is happening.Fundamental Context
The selling is not a reaction to weak earnings. Colgate-Palmolive reported quarterly revenue of $5.37 billion for the quarter ended September 30, 2026, up 4.6% from $5.13 billion a year earlier, and net income of $751.0 million versus $735.0 million, according to its SEC filing dated October 30. Diluted earnings per share were $0.94. Steady top- and bottom-line growth gives the technical consolidation a fundamentally stable backdrop.Key Levels & Scenarios
Support sits at 91.69 for the 20-day window; a decisive break there would invalidate the bullish trend structure and open a retest toward the 50-day average at 91.83 — a cluster that makes the low-90s the line in the sand. Resistance is 100.99 on the 20-day measure, with the three-month high of 101.81 just above. A close above 100.99 would confirm the pullback has ended and set the stage for a retest of the high; a failure to hold the mid-90s keeps the stock pinned in its current drift.Technical Verdict: HOLD (wait & see)
The verdict is HOLD (wait & see), because trend and momentum are not yet aligned. Three reasons underpin the call: first, price remains above both the 20-day and 50-day averages and the 20-day average is still rising 1.21% over five days, so the uptrend is intact; second, the MACD histogram has just turned negative and the RSI has rolled over from above 65, meaning momentum has not yet caught up with the trend; third, the stochastic %K at 24.8 versus %D at 53.6 confirms short-term weakness rather than a reversal. The verdict is invalidated if price breaks decisively below the 20-day support at 91.69. - Entry range: a close above the 20-day resistance of 100.99 (upside scenario); alternatively, a confirmed hold of support near 93.54, the price minus 1.5×ATR level - Exit target: 100.22 (price plus 1.5×ATR) in the upside scenario, with the three-month high at 101.81 as the outer marker - Stop loss: a break below 91.69, which sits just under the 50-day average at 91.83 For a non-trader: the stock is in an uptrend but has lost its forward push, so the data favours watching for a confirmed move above resistance before treating the pullback as finished.| Indicator | Reading | Signal |
|---|---|---|
| Last price | 96.88 USD | −1.99% (1 day) |
| 20-day / 50-day SMA | 96.72 / 91.83 | Price above both; uptrend |
| RSI(14) | 53.0 | Neutral; rolling over from above 65 |
| MACD histogram | −0.184 | Just turned negative |
| Stochastic %K / %D | 24.8 / 53.6 | Neutral; short-term deceleration |
| Bollinger %B | 52% | Just above middle band |
| ATR(14) | 2.22 (2.3%) | Moderate volatility |
| Volume | 6,383,700 | 1.2× 20-day average; OBV falling |
| Support / Resistance — 20 days | 91.69 / 100.99 | Upper-half of range |
| 3-month high / low | 101.81 / 83.99 | — |
Summary Data CL
| Last price | 96.88 USD |
| Change 1 day / 5 days / 1 month | -1.99% / -1.04% / -0.52% |
| Trend / MA-cross | uptrend / none |
| SMA20 / SMA50 | 96.72 / 91.83 |
| RSI (14) / Stochastic %K | 53.0 / 24.8 |
| Bollinger %B / ATR | 52% / 2.22 |
| Support / Resistance 20 days | 91.69 / 100.99 |
| Data as of | 20 November 2026 04:00 WIB |
| JournalArta research verdict (score) | Hold (+50) |
Today's full Buy and Sell list for US stocks →
Disclaimer: This technical analysis is generated automatically from exchange data and indicators calculated by JournalArta, for information and education only. The verdict and the entry, target and stop-loss levels are not investment advice or a solicitation to buy or sell any security. Investment decisions and their risks rest solely with the reader.
Track CL stock price daily: live levels, support/resistance and our full CL analysis history.
 Take the quizWhat Kind of Holiday Spender Are You? Take the Black Friday QuizStart →





 Lifestyle · Food & HealthNormal Blood Pressure Chart by Age: Healthy Ranges Explained
 Lifestyle · Food & HealthWhat Is Raynaud’s Syndrome? Why Fingers Turn White in the Cold
 Lifestyle · Food & Health4 Ways Walking After Meals Helps Your Body, Doctors Say
 Lifestyle · Food & Health4 Reasons to Eat Oatmeal, According to Nutrition Experts