Vodafone Share Price Slides 4.03% on Thursday, Near a 3-Month Low
Technical analysis of Vodafone stock on November 19, 2026: price 109.45 GBp, trend downtrend, RSI 31.5, support 109.45, resistance 121.15.

Why Vodafone is in focus today
- One-day move of 0.00%, about 0.0× its average daily range (ATR)
Selected automatically from 10 LSE (UK) stocks by a technical-signal score with daily weighted randomisation — not a recommendation.
Trend & Price Action
The structure is decisively negative. Vodafone trades below both its 20-day average of 117.11p and its 50-day average of 121.38p, and the shorter average is itself falling — down 1.10% over the past five sessions. The 20-day average also sits below the 50-day, the classic configuration of a sustained downtrend. No fresh moving-average cross formed in the latest session, but the existing alignment already tells the story: every major trend reference is now a ceiling rather than a floor.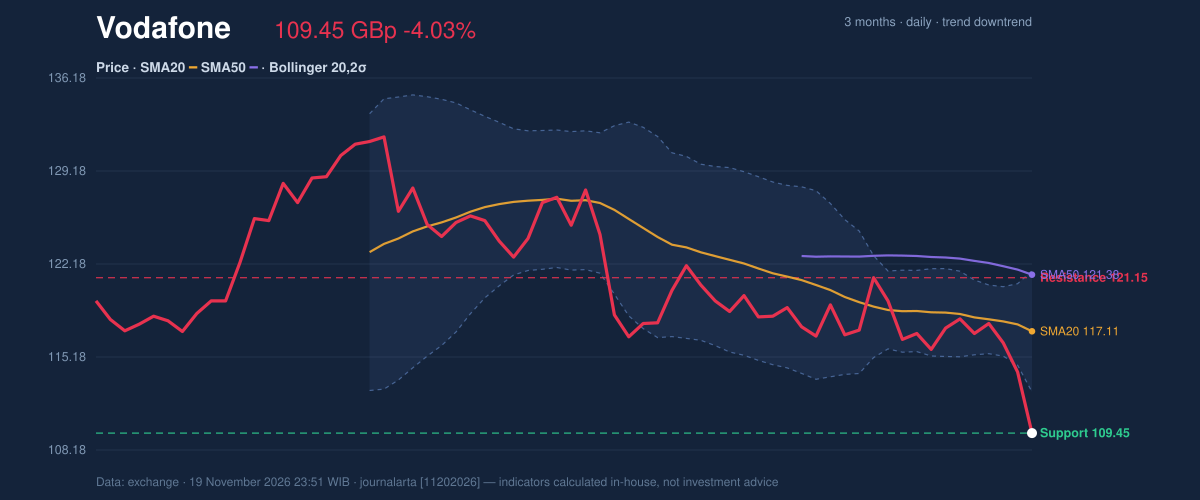
Oscillators & Momentum
The momentum picture is where the severity shows. The 14-day RSI reads 31.5, labelled neutral in the data but close enough to the 30 oversold threshold that any further weakness tips it over. The stochastic oscillator is far more extreme: %K at 1.5 against %D at 10.1, deep in oversold territory and with the faster line pinned near zero — a reading that often precedes a technical bounce, though not necessarily a durable one.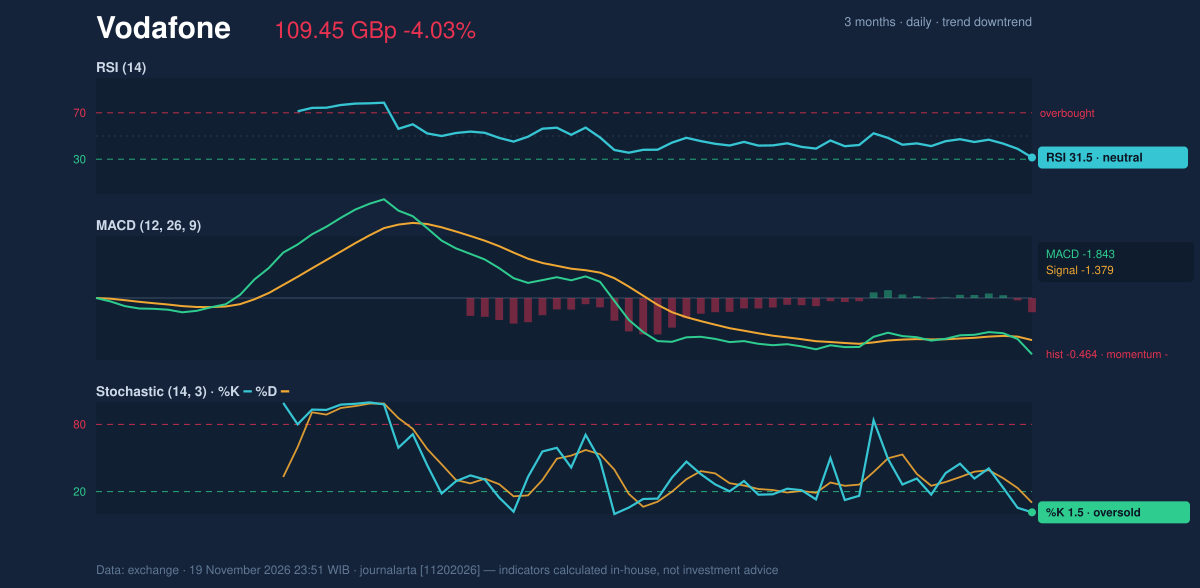
Volatility & Volume
Bollinger bands offer the most interesting signal. The band width has narrowed to 7.8%, a squeeze that typically signals an impending expansion in volatility. That expansion has already resolved — downward. The %B reading of -34% means the price closed below the lower band at 112.55p, a break that in a squeeze context signals a decisive downside resolution rather than a routine overshoot. The ATR of 3.12, or 2.9% of the price, puts daily volatility in moderate territory — enough for the stop to matter, not enough to suggest panic.Key Levels & Scenarios
The immediate map is narrow. Resistance sits at 121.15p, with the 20-day average at 117.11p as an intermediate hurdle and the 50-day at 121.38p reinforcing the band's upper edge near 121.67p. Below, the three-month low of 109.25p is the only meaningful reference, and the stock closed just 0.2p above it. If the price fails to hold 109.25p, there is little structural support beneath it — the range simply opens up. If it stabilises and reclaims 112.55p, the lower Bollinger band, that would mark the first sign the squeeze breakdown was a false resolution rather than a genuine one.Technical Verdict: SELL
The JournalArta research verdict is SELL, scoring -84 on a scale where -60 or below triggers the call. Three bearish signals carry it: the MACD histogram has just turned negative, the Bollinger squeeze resolved with a close below the lower band, and the downtrend is confirmed by falling OBV. Against that, there are zero bullish signals in the data — the oversold stochastic is a risk to the call, not a reason to reverse it. Sell zone: 109.45p – 111.78p Target 1: 101.49p Target 2: 93.52p Stop loss: 114.76p The reward-to-risk ratio is 1.5 to the first target and 3.0 to the second. The verdict is invalidated if the price closes back above 114.76p, which would place it above the sell zone and back inside the prior trading range. The call runs until 17 December 2026. In plain terms: the technical evidence points to further weakness toward 101.49p before the stock finds a floor, and the setup would only be wrong if it climbed back above 114.76p first. The next test is whether the 109.25p three-month low holds at Friday's open — the first close below it would confirm the squeeze breakdown was real.Summary Data Vodafone
| Last price | 109.45 GBp |
| Change 1 day / 5 days / 1 month | -4.03% / -7.29% / -8.64% |
| Trend / MA-cross | downtrend / none |
| SMA20 / SMA50 | 117.11 / 121.38 |
| RSI (14) / Stochastic %K | 31.5 / 1.5 |
| Bollinger %B / ATR | -34% / 3.12 |
| Support / Resistance 20 days | 109.45 / 121.15 |
| Data as of | 19 November 2026 23:51 WIB |
| JournalArta research verdict (score) | Sell (-84) |
| Sell zone | 109.45 – 111.78 |
| Target 1 / 2 | 101.49 / 93.52 |
| Stop loss | 114.76 |
| Reward/risk | 1.5 / 3.0 |
Today's full Buy and Sell list for UK, Singapore & Hong Kong stocks →
Disclaimer: This technical analysis is generated automatically from exchange data and indicators calculated by JournalArta, for information and education only. The verdict and the entry, target and stop-loss levels are not investment advice or a solicitation to buy or sell any security. Investment decisions and their risks rest solely with the reader.
Track Vodafone share price daily: live levels, support/resistance and our full Vodafone analysis history.
 Take the quizWhat Kind of Holiday Spender Are You? Take the Black Friday QuizStart →





 Lifestyle · Food & HealthWhat Is Raynaud’s Syndrome? Why Fingers Turn White in the Cold
 Lifestyle · Food & Health4 Ways Walking After Meals Helps Your Body, Doctors Say
 Lifestyle · Food & Health4 Reasons to Eat Oatmeal, According to Nutrition Experts
 Lifestyle7 Signs Your Social Battery Is Running Low (and Why You Keep Cancelling Plans)