Vodafone Stock Drops 1.00% on Tuesday, Death Cross Pressure
On October 20, 2026: price 119.40 GBp, trend downtrend, RSI 43.4, support 116.70, resistance 127.75. technical analysis of vodafone stock.
Trend & Price Action
Vodafone’s 20-day simple moving average (SMA20) has crossed below its 50-day average (SMA50), a pattern known as a death cross. It suggests recent price weakness is becoming more pronounced relative to the longer trend. The SMA20 is sloping down 1.70% over five trading days, and the latest price sits below both the SMA20 at 122.77 GBp and SMA50 at 122.93 GBp. The share has gained 1.44% over five days, but remains down 4.59% over one month. That short-term bounce has not yet reversed the broader decline: the price is still about 2.7% below the SMA20, leaving that average as a near-term test of whether buyers can regain ground. As shown in the chart, Vodafone is in the lower part of its recent trading range, nearer support than resistance. Its Bollinger Band %B reading of 25% places the price in the lower quarter of the band, but not at the lower boundary. The bands are at 116.03 GBp and 129.52 GBp, with a normal width of 11.0%—not a squeeze signalling unusually compressed trading.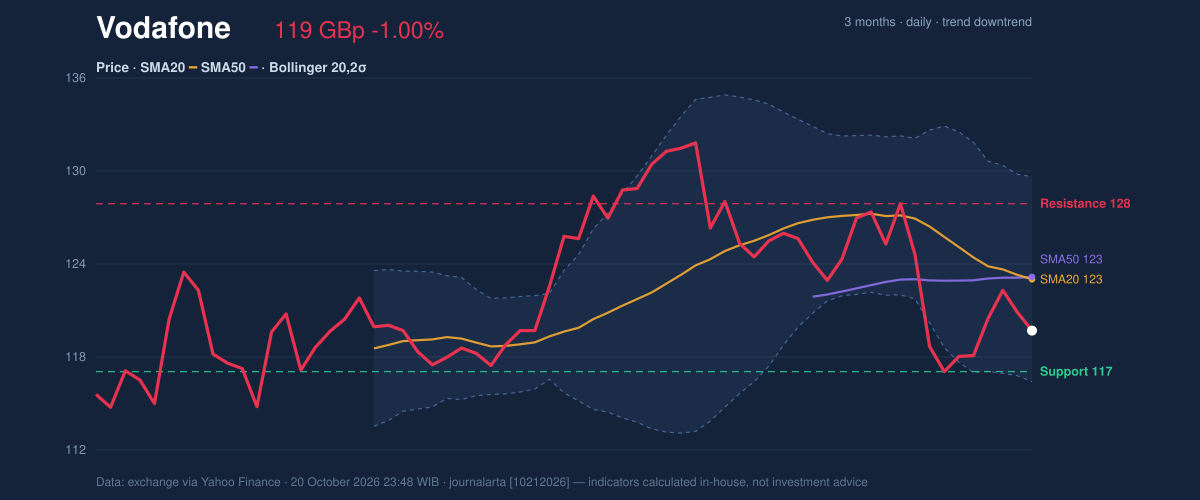
Oscillators & Momentum
The momentum picture is mixed, but leans weak. The RSI is 43.4, a neutral reading, meaning the price is not in oversold territory even after its monthly decline. The Stochastic oscillator, which compares the latest close with its recent trading range, has %K at 92.6 and %D at 58.3. That puts %K in overbought territory, a warning that the recent bounce may be stretched rather than evidence of a durable turn. The MACD reinforces the cautious reading. Its value of -1.296 is below the signal line at -0.809, and the histogram is negative at -0.487. Negative MACD momentum indicates that downward pressure remains in place, despite the five-day gain. A stronger recovery would need the price to improve alongside momentum, rather than relying on a single short-term oscillator.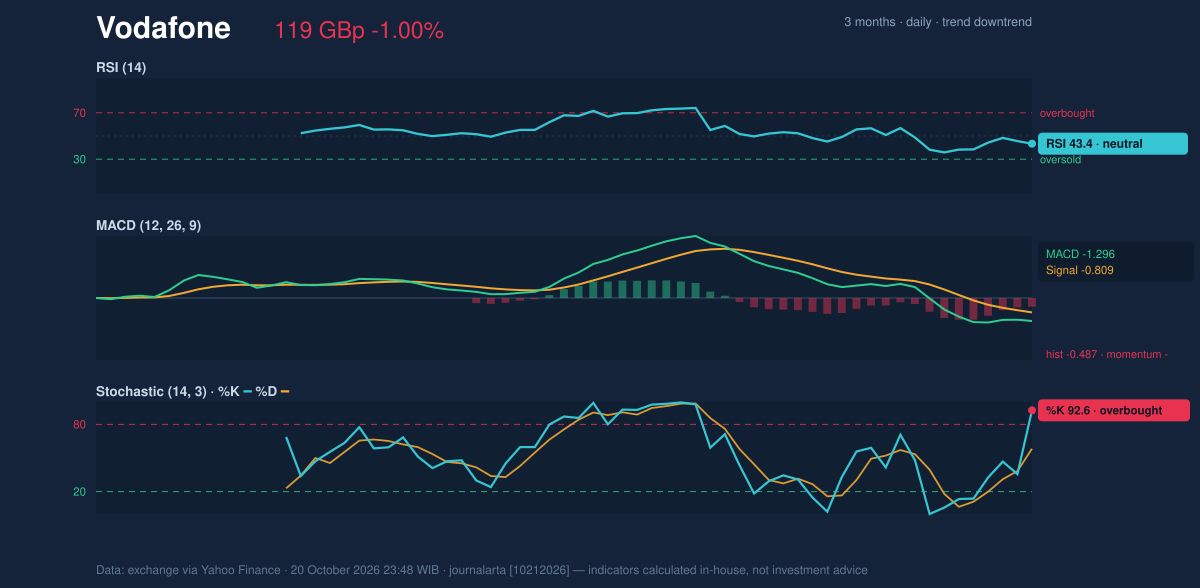
Volatility, Volume & Key Levels
Volatility is high: the average true range (ATR), a measure of typical daily price movement, is 11.63 GBp, or 9.7% of the share price. This means moves can be substantial relative to the current price, so levels should be read as zones of potential reaction rather than precise turning points. Trading volume was 9,356,395 shares, just 0.2 times the 20-day average of 49,999,991. That thin participation weakens the significance of the latest move: the five-day rise has not been accompanied by volume near its recent norm. On the other hand, on-balance volume (OBV), which tracks whether volume is associated with buying or selling, is rising. The divergence is a tentative positive signal, but low turnover makes it less convincing. The first key floor is support at 116.70 GBp. A break below it would put the lower Bollinger Band at 116.03 GBp in view and strengthen the case that the downtrend is extending. On the upside, resistance at 127.75 GBp is the more substantial hurdle; before reaching it, the share would need to reclaim the closely grouped SMA20 and SMA50 around 122.77–122.93 GBp. The three-month high is 132.07 GBp; the supplied low is 0.00 and does not provide a useful practical range floor.Technical Verdict: HOLD (wait & see)
The technical balance supports a wait-and-see reading, rather than a clear directional signal. The death cross, falling SMA20 and negative MACD point to persistent weakness. Against that, OBV is rising and price is near established support, while RSI remains neutral rather than deeply oversold. - Indicative entry range: 116.70–122.93 GBp, bounded by support and the SMA20/SMA50 zone. - Exit target: 127.75 GBp, the stated resistance. - Stop-loss protection reference: 116.03 GBp, the lower Bollinger Band. - Invalidation: the cautious verdict is invalidated if price breaks below 116.70 GBp, signalling a loss of the stated support. For non-traders, the indicators show a share still under pressure, with support nearby but no confirmed reversal. Vodafone’s last recorded price was 119.40 GBp.Data: London Stock Exchange via Yahoo Finance, as of 20 October 2026, 23:48 WIB. Technical analysis is not an investment recommendation.
Why Vodafone is in focus today
- Fresh death cross: SMA20 crossed below SMA50
Selected automatically from 16 LSE (UK) stocks by a technical-signal score with daily weighted randomisation — not a recommendation.
Summary Data Vodafone
| Last price | 119.40 GBp |
| Change 1 day / 5 days / 1 month | -1.00% / 1.44% / -4.59% |
| Trend / MA-cross | downtrend / death |
| SMA20 / SMA50 | 122.77 / 122.93 |
| RSI (14) / Stochastic %K | 43.4 / 92.6 |
| Bollinger %B / ATR | 25% / 11.63 |
| Support / Resistance 20 days | 116.70 / 127.75 |
| Data as of | 20 October 2026 23:48 WIB |
Disclaimer: This technical analysis is generated automatically from exchange data (via Yahoo Finance) and indicators calculated by JournalArta, for information and education only. The verdict and the entry, target and stop-loss levels are not investment advice or a solicitation to buy or sell any security. Investment decisions and their risks rest solely with the reader.
Track Vodafone share price daily: live levels, support/resistance and our full Vodafone analysis history.