BAT Stock Drops 0.45% on Tuesday, Golden Cross Formed
On October 20, 2026: price 4,419.00 GBp, trend uptrend, RSI 65.8, support 3,960.00, resistance 4,457.00. technical analysis of bat stock.
Why BAT is in focus today
- Fresh golden cross: SMA20 crossed above SMA50
- Uptrend confirmed (5-day change 4.59%)
Selected automatically from 16 LSE (UK) stocks by a technical-signal score with daily weighted randomisation — not a recommendation.
Trend & Price Action
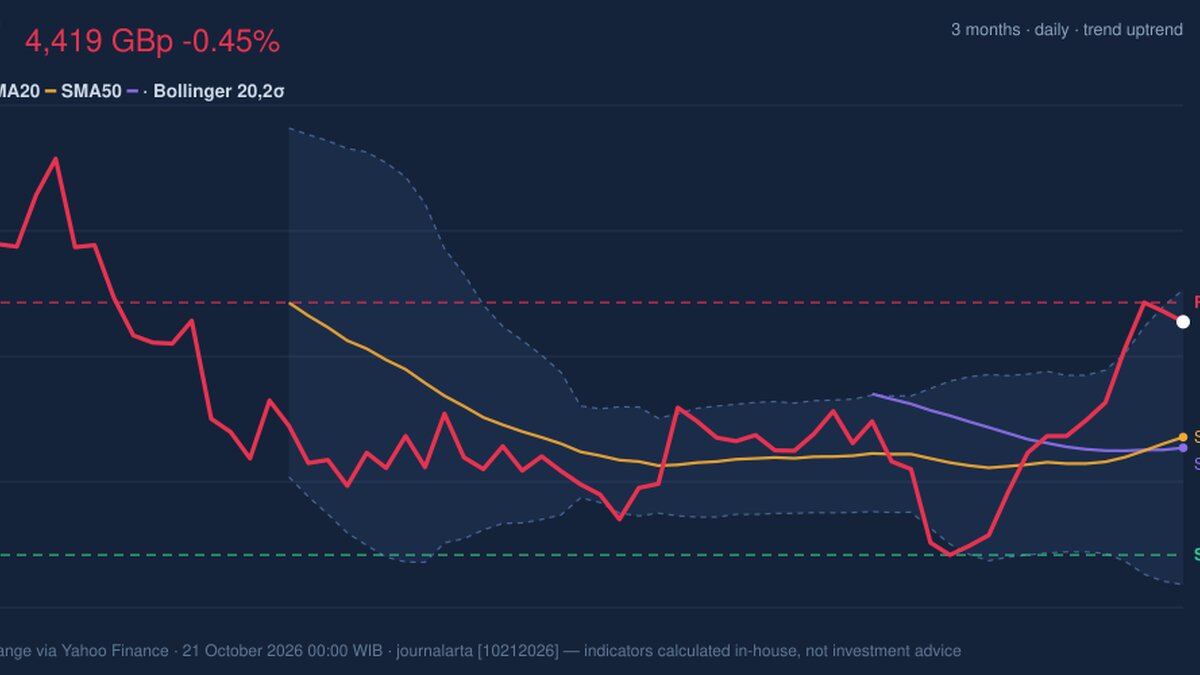
BAT’s share price sits above both its 20-day simple moving average, or SMA20, at 4,191.85 and its 50-day average at 4,170.86. The SMA20 has crossed above the SMA50, a pattern known as a golden cross. It suggests recent price strength is overtaking the slower trend, while the SMA20’s 1.25% rise over five days indicates that the shorter-term average is still climbing. The move has momentum: BAT gained 6.10% over a month. But at 4,419.00 GBp, it is only 38 GBp below the 20-trading-day resistance at 4,457.00. That leaves little room before the price tests a level where recent trading has met selling pressure. The share is at 92% of its stated 20-day range, so it is trading near the top rather than breaking out from a low base. As shown in the chart, price is also approaching the upper Bollinger Band at 4,482.21. Bollinger Bands plot a moving average with upper and lower boundaries based on price variation; nearing the upper band signals strength, but can also mean the share is extended relative to its recent trading pattern.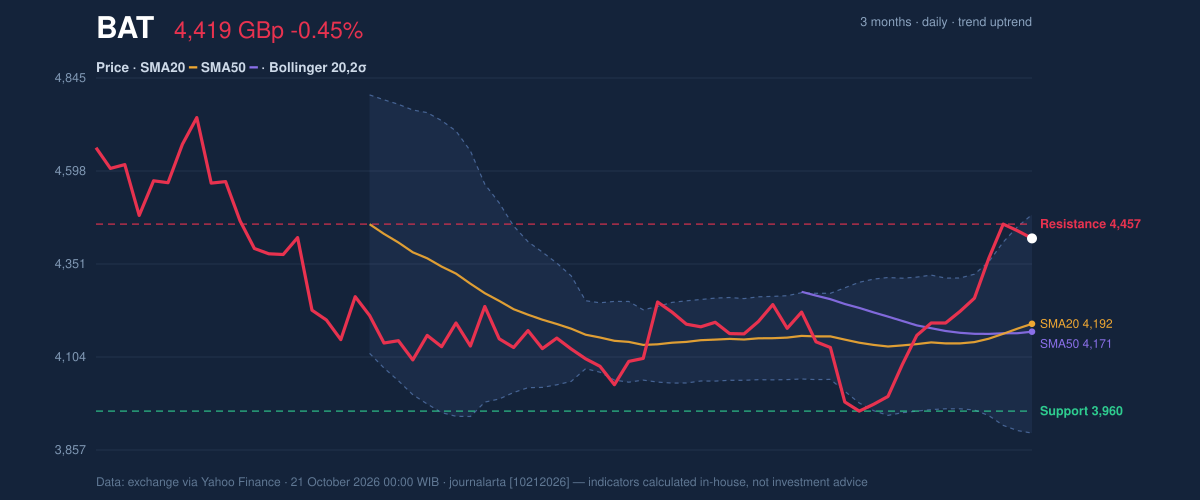
Oscillators & Momentum
The momentum indicators are positive, but not uniformly comfortable. The RSI is 65.8, classified as neutral in the supplied data; it points to firm momentum without yet registering an overbought reading. The Stochastic readings, %K at 98.8 and %D at 96.4, are overbought, showing that the latest advance has been rapid compared with the share’s recent price range. The MACD is positive at 59.611 against a 16.788 signal line, with a positive histogram of 42.822. MACD compares shorter- and longer-term price momentum: its position above the signal line supports the upward trend, though it does not remove the risk of a pullback after a sharp run. The combination matters. The golden cross and positive MACD show trend confirmation; the elevated Stochastic warns that the pace may be difficult to sustain without pauses. The chart helps distinguish those signals: RSI, MACD and Stochastic measure different aspects of momentum, rather than offering three identical confirmations.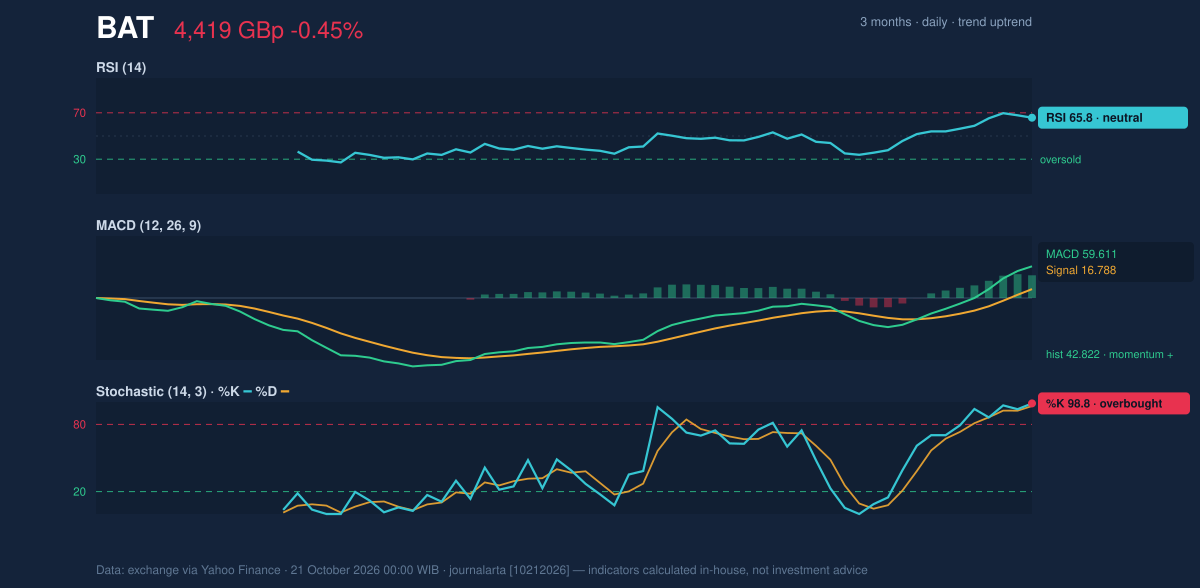
Volatility, Volume & Key Levels
The Bollinger Band width is 13.9%, described as normal, while %B is 89%—a reading close to the upper band. This reinforces the picture of a strong price near the upper end of its recent volatility envelope, rather than a quiet consolidation. ATR, a measure of typical price movement, is 401.21 GBp, or 9.1% of the share price. That is high volatility: moves can be substantial, making nearby technical levels less certain as precise stopping points. Participation is a caveat. Latest volume was 312,854, just 0.1 times the 20-day average of 3,252,150, indicating thin trading in the latest session. OBV, which tracks whether volume generally accompanies rising or falling prices, is rising. That offers some underlying confirmation, but the sparse session volume means the day’s small decline is not a strong test of conviction. The immediate test is resistance at 4,457.00 GBp, followed by the upper band at 4,482.21. A sustained move above resistance would suggest buyers can extend the advance; failure there could leave the price vulnerable to a retreat toward the rising averages. Support at 3,960.00 GBp is the key stated 20-day floor, with the SMA20 at 4,191.85 an intervening trend reference. The supplied three-month low is 0.00, which is not a useful practical support level for scenario analysis.Technical Verdict: HOLD (wait & see)
HOLD (wait & see) fits the mixed setup: the golden cross, rising short-term average and positive MACD support the trend, while the Stochastic is overbought and price is close to resistance. Thin latest-session volume also limits confirmation of the advance. The verdict is invalidated if price falls below 3,960.00 GBp, the stated support level.- Entry range: 4,191.85–4,419.00 GBp, framed by the SMA20 and latest price.
- Exit target: 4,457.00–4,482.21 GBp, the stated resistance and upper Bollinger Band.
- Stop-loss protection: 3,960.00 GBp, the stated support level.
| Metric | Reading |
|---|---|
| Last price | 4,419.00 GBp |
| Daily change | -0.45% |
| SMA20 / SMA50 | 4,191.85 / 4,170.86 |
| RSI / Stochastic | 65.8 / 98.8 and 96.4 |
| MACD / signal | 59.611 / 16.788 |
| Support / resistance | 3,960.00 / 4,457.00 GBp |
Summary Data BAT
| Last price | 4,419.00 GBp |
| Change 1 day / 5 days / 1 month | -0.45% / 4.59% / 6.10% |
| Trend / MA-cross | uptrend / golden |
| SMA20 / SMA50 | 4,191.85 / 4,170.86 |
| RSI (14) / Stochastic %K | 65.8 / 98.8 |
| Bollinger %B / ATR | 89% / 401.21 |
| Support / Resistance 20 days | 3,960.00 / 4,457.00 |
| Data as of | 21 October 2026 00:00 WIB |
Disclaimer: This technical analysis is generated automatically from exchange data (via Yahoo Finance) and indicators calculated by JournalArta, for information and education only. The verdict and the entry, target and stop-loss levels are not investment advice or a solicitation to buy or sell any security. Investment decisions and their risks rest solely with the reader.
Track BAT share price daily: live levels, support/resistance and our full BAT analysis history.