Rolls-Royce Stock Drops 0.68%, Testing Support Level In Focus
On October 20, 2026: price 1,322.60 GBp, trend downtrend, RSI 31.8, support 1,322.60, resistance 1,503.20. technical analysis of rolls-royce stock.
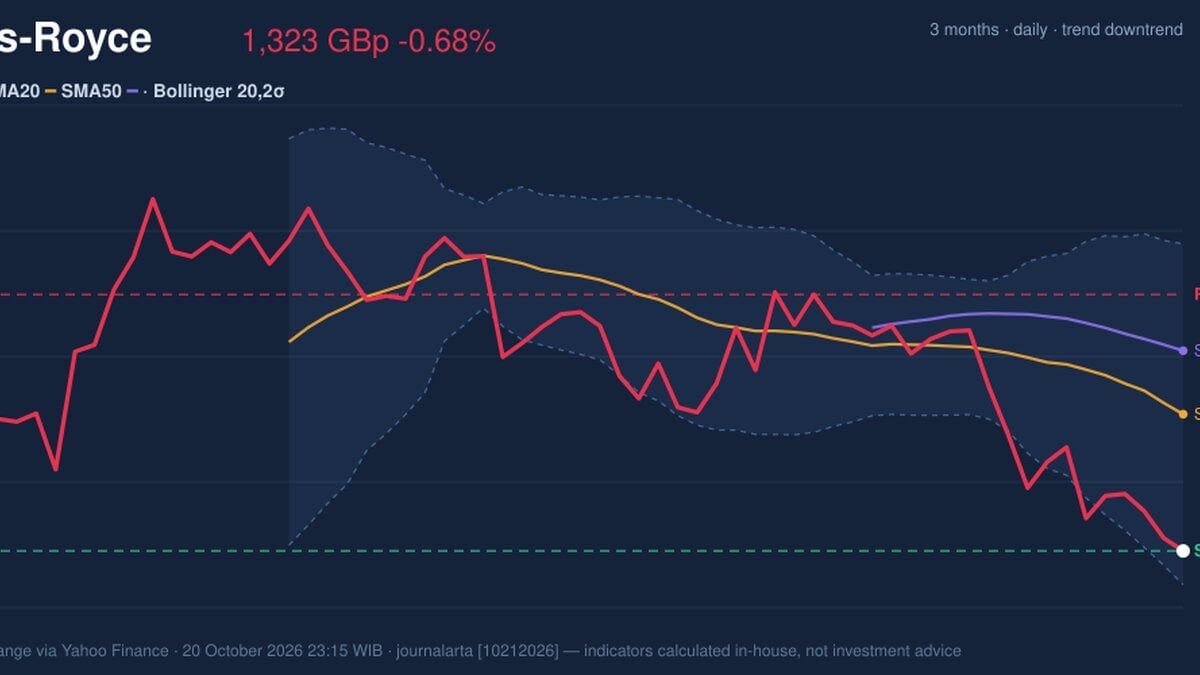
Why Rolls-Royce is in focus today
- Closed at a 20-day low (1,322.60)
- Downtrend extending (5-day change -1.71%)
Selected automatically from 16 LSE (UK) stocks by a technical-signal score with daily weighted randomisation — not a recommendation.
Trend & Price Action
The price is well below the 20-day simple moving average (SMA) at 1,418.89 and the 50-day SMA at 1,463.59. The 20-day average is also declining, with its slope at -2.17% over five days. Together, those readings point to a downtrend rather than a single-session setback. There has been no new moving-average crossover, so the data do not show a fresh technical turning point. At 1,322.60 GBp, the shares sit at the 20-day support level and at the bottom of the stated 20-day range. That makes the next price response important: holding the level would show that buyers are defending the recent low, while a break below it would mark a new deterioration in the chart. The stated 20-day resistance is 1,503.20.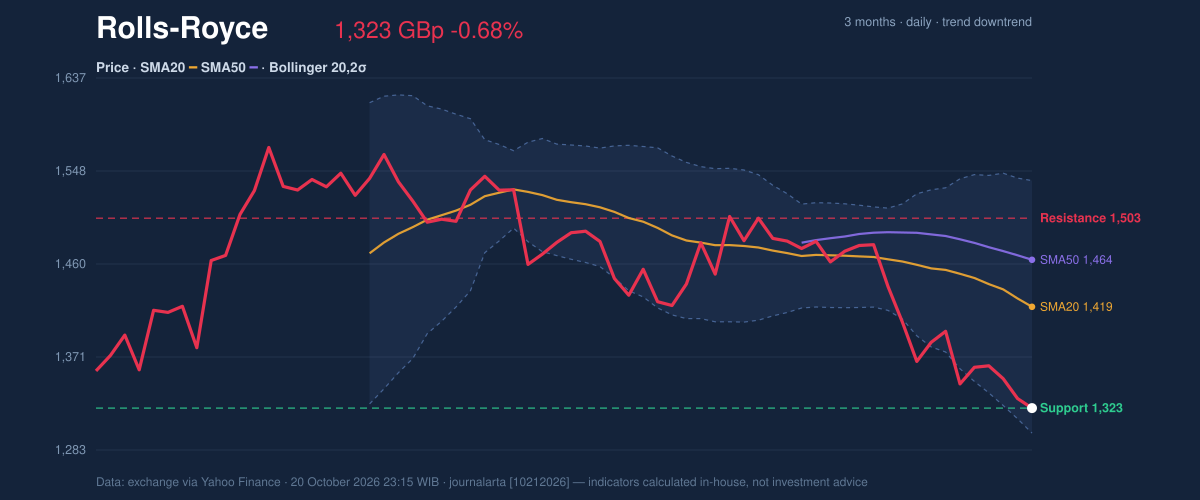
Oscillators & Momentum
The indicators give a mixed, but still fragile, reading. RSI is 31.8, labelled neutral in the supplied data; it is close to the commonly watched oversold zone, but does not itself confirm a reversal. The Stochastic oscillator has %K at 84.4 and %D at 33.8, with the reading classified as overbought. This gap suggests a sharp near-term push in the oscillator, but against a falling price trend it is not enough to establish durable momentum. MACD remains negative at -36.563, below its -26.635 signal line, with a -9.929 histogram. MACD compares shorter- and longer-term price averages to gauge momentum; its negative reading and position below the signal line indicate that downward momentum remains in control. The contrast between an elevated Stochastic reading and negative MACD underlines why a short-lived bounce and a trend reversal are not the same thing.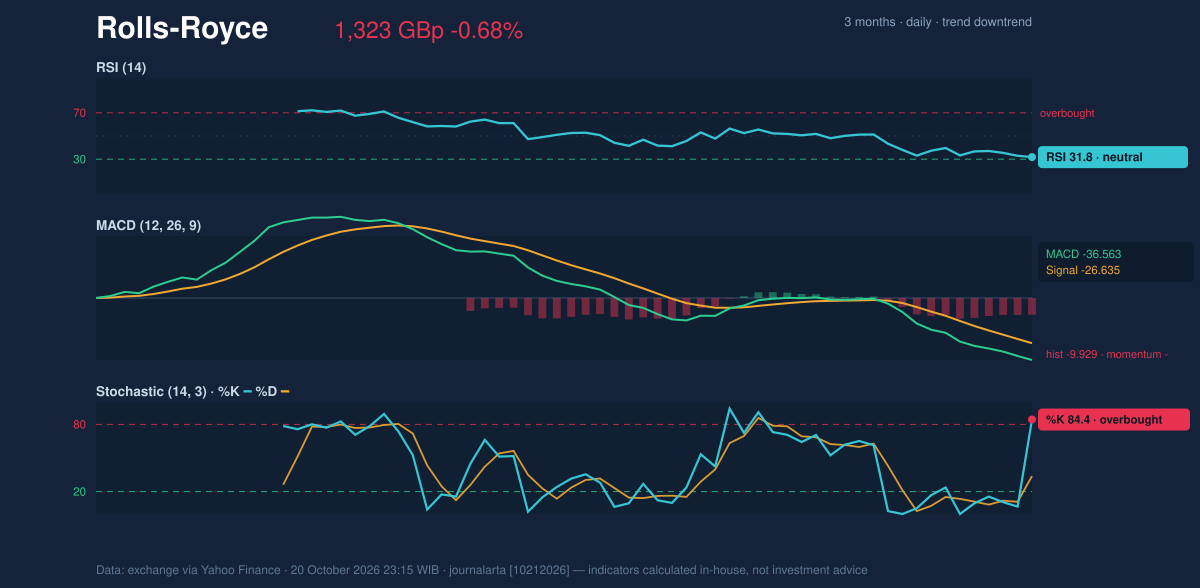
Volatility & Volume
Average True Range (ATR), a measure of typical price movement, is 142.19 GBp, or 10.8% of the last price. That is high volatility: price swings can be large relative to the share price, making nearby technical levels less reliable as precise boundaries. The last session’s volume was 4,540,968 shares, only 0.3 times the 20-day average of 17,720,788, so the decline came on thin participation rather than a surge in trading. On-Balance Volume is rising despite the price weakness. OBV adds volume on rising sessions and subtracts it on falling ones, using the running total as a rough gauge of buying or selling participation. Its rise may signal that selling pressure is not broadly confirmed by volume, but the thin latest session and persistent downtrend make that a tentative counter-signal, not a reversal confirmation.Technical Verdict: HOLD (wait & see)
HOLD (wait & see) is the clearest technical reading: the downtrend and negative MACD argue against calling a reversal, while rising OBV and proximity to the lower Bollinger Band caution against treating weakness as confirmed acceleration. - Ideal Entry Range: 1,298.83–1,322.60 GBp, using the lower Bollinger Band and stated 20-day support as reference levels. - Exit Target (Target Price): 1,418.89 GBp, the 20-day SMA; the next stated resistance is 1,503.20 GBp. - Stop Loss protection: Below 1,298.83 GBp, the lower Bollinger Band. - Invalidation: The verdict is invalidated if price breaks below 1,322.60 GBp support. In plain English, the chart has not yet shown that the decline has turned, so confirmation matters more than a single low-volume session.Summary Data Rolls-Royce
| Last price | 1,322.60 GBp |
| Change 1 day / 5 days / 1 month | -0.68% / -1.71% / -10.74% |
| Trend / MA-cross | downtrend / none |
| SMA20 / SMA50 | 1,418.89 / 1,463.59 |
| RSI (14) / Stochastic %K | 31.8 / 84.4 |
| Bollinger %B / ATR | 10% / 142.19 |
| Support / Resistance 20 days | 1,322.60 / 1,503.20 |
| Data as of | 20 October 2026 23:15 WIB |
Disclaimer: This technical analysis is generated automatically from exchange data (via Yahoo Finance) and indicators calculated by JournalArta, for information and education only. The verdict and the entry, target and stop-loss levels are not investment advice or a solicitation to buy or sell any security. Investment decisions and their risks rest solely with the reader.
Track Rolls-Royce share price daily: live levels, support/resistance and our full Rolls-Royce analysis history.