RELX Stock Drops 0.31% on Tuesday, RSI Overbought
On October 20, 2026: price 2,928.00 GBp, trend uptrend, RSI 77.5, support 2,480.00, resistance 2,937.00. technical analysis of relx stock.
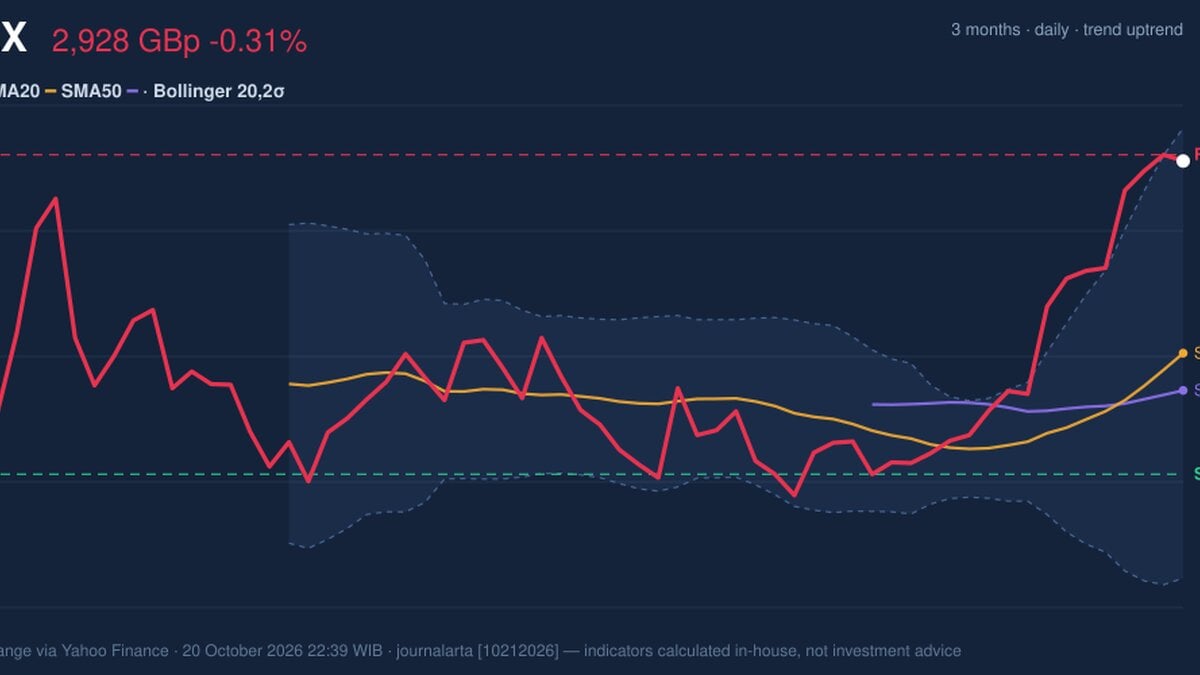
Why RELX is in focus today
- Trading near its 3-month high (2,958.00)
- Fresh golden cross: SMA20 crossed above SMA50
- RSI(14) at 77.5 — overbought zone
- Uptrend confirmed (5-day change 5.67%)
Selected automatically from 16 LSE (UK) stocks by a technical-signal score with daily weighted randomisation — not a recommendation.
Trend & Price Action
RELX has risen 19.51% over one month, and its upward trend is supported by a rising SMA20, the average closing price over 20 trading days. The SMA20 is at 2,653.30 GBp, above the SMA50 at 2,600.02 GBp; the crossover of the shorter average above the longer one is known as a golden cross, a sign that recent price momentum has strengthened relative to the broader trend. The price remains well above both averages, but that gap also means the recent run has left the shares extended. RELX is at roughly 98% of its 20-day range, between support at 2,480.00 GBp and resistance at 2,937.00 GBp. The latest close was 0.31% lower than the previous close, while the upper Bollinger band—an indicator that frames price movement around a moving average—sits at 2,975.03 GBp. With the price at 93% of the band’s range, it is pressing towards the upper edge rather than trading near its recent average. The three-month high is 2,958.00 GBp. Its corresponding low is listed as 0.00, which does not provide a meaningful lower reference for interpreting the period’s range.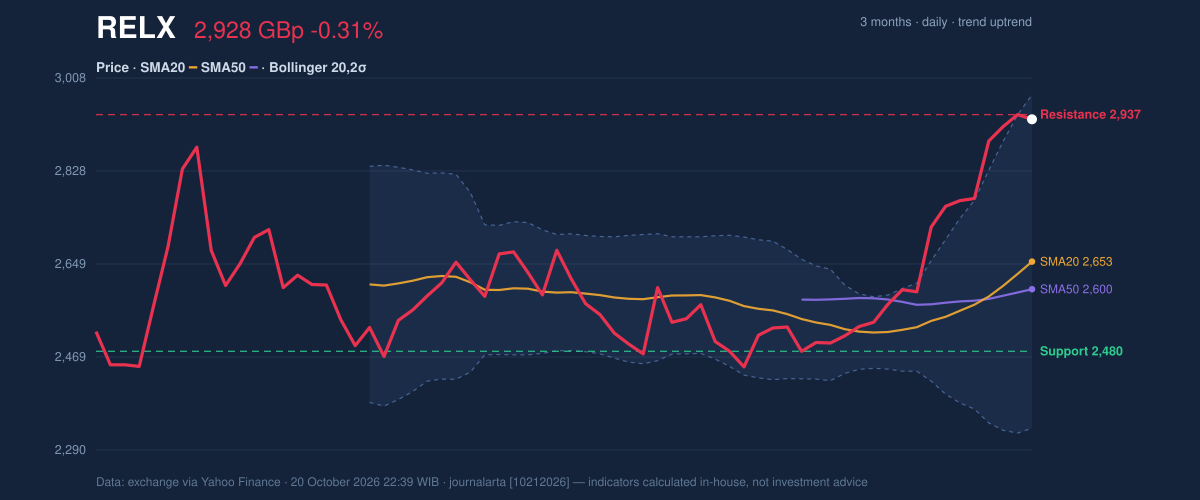
Oscillators & Momentum
Momentum indicators confirm the recent advance but warn that it may be crowded. The RSI is 77.5, in overbought territory; the Stochastic readings are also elevated, with %K at 99.0 and %D at 95.6. These measures compare recent gains and losses or the closing price’s position in its recent range. High readings do not, by themselves, predict a fall, but they indicate that buying has been unusually forceful and that further gains may be more vulnerable to a pause. The MACD, a trend-following measure, remains positive: its reading of 96.176 is above its signal line at 56.679, leaving a positive histogram of 39.497. That supports the upward trend rather than confirming a reversal. The key tension is therefore between strong trend momentum and short-term exhaustion signals.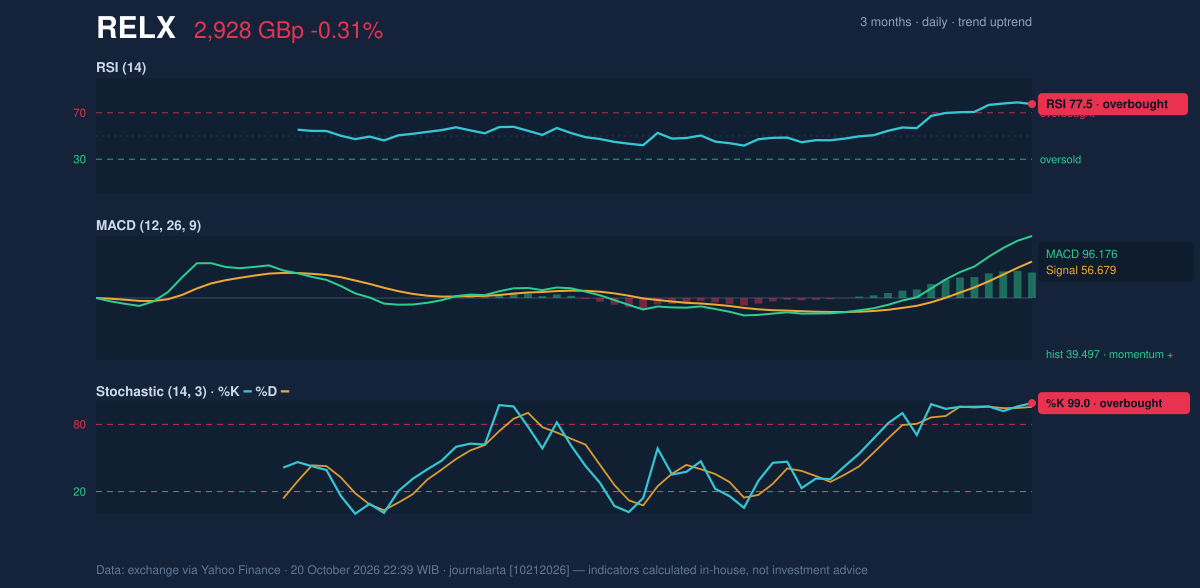
Volatility & Volume
The Bollinger bands are widening, with a reported width of 24.3%. Widening bands indicate that price swings have increased; they do not specify direction. The ATR, which estimates typical movement, is 281.22 GBp, or 9.6% of the share price, also pointing to high volatility. That makes a move around the nearby resistance potentially less orderly than the trend line alone might suggest. Volume offers little confirmation for the latest session. Reported volume was 171 against a 20-day average of 3,956,614, classified in the data as thin, while OBV—an indicator that accumulates volume according to price direction—was rising. The rising OBV is consistent with broader accumulation, but the exceptionally low latest reading means that session itself provides weak evidence of broad participation.Key Levels & Scenarios
The immediate test is resistance at 2,937.00 GBp, followed by the three-month high at 2,958.00 GBp. A sustained move above those levels would show that buyers had overcome the nearest visible ceiling; failure to clear them could leave the overbought indicators to weigh on the price. The upper Bollinger band at 2,975.03 GBp is another reference, not a guaranteed cap. On a pullback, the rising SMA20 at 2,653.30 GBp is a nearer trend gauge, with the SMA50 at 2,600.02 GBp below it. The lower 20-day support at 2,480.00 GBp marks a deeper level at which the current technical setup would be materially weaker. A retreat toward averages would not automatically end the uptrend, but a fall through support would challenge the bullish structure.Technical Verdict: HOLD (wait & see)
The technical evidence is mixed: the golden cross, rising SMA20 and positive MACD favour the prevailing uptrend, while RSI and Stochastic readings signal overbought conditions. The price is close to resistance, and high ATR means the risk of sharp swings is elevated. The core signal is an intact uptrend with limited room before resistance and clear short-term overheating. - Ideal Entry Range: 2,653.30–2,600.02 GBp, around the SMA20 and SMA50 support zone. - Exit Target (Target Price): 2,958.00–2,975.03 GBp, using the three-month high and upper Bollinger band as technical reference levels. - Stop Loss protection: 2,480.00 GBp, at 20-day support. - Invalidation: The HOLD verdict is invalidated if the price falls below 2,480.00 GBp. In plain English, the trend is rising, but the price is stretched near resistance and the next move needs confirmation.| Metric | Reading |
|---|---|
| Last price | 2,928.00 GBp |
| Daily change | -0.31% |
| Five-day change | +5.67% |
| One-month change | +19.51% |
| SMA20 / SMA50 | 2,653.30 / 2,600.02 GBp |
| RSI / Stochastic %K and %D | 77.5 / 99.0 and 95.6 |
| MACD / signal / histogram | 96.176 / 56.679 / 39.497 |
| ATR / Bollinger width | 281.22 GBp / 24.3% |
| Volume / 20-day average | 171 / 3,956,614 |
| Support / resistance | 2,480.00 / 2,937.00 GBp |
Summary Data RELX
| Last price | 2,928.00 GBp |
| Change 1 day / 5 days / 1 month | -0.31% / 5.67% / 19.51% |
| Trend / MA-cross | uptrend / golden |
| SMA20 / SMA50 | 2,653.30 / 2,600.02 |
| RSI (14) / Stochastic %K | 77.5 / 99.0 |
| Bollinger %B / ATR | 93% / 281.22 |
| Support / Resistance 20 days | 2,480.00 / 2,937.00 |
| Data as of | 20 October 2026 22:39 WIB |
Disclaimer: This technical analysis is generated automatically from exchange data (via Yahoo Finance) and indicators calculated by JournalArta, for information and education only. The verdict and the entry, target and stop-loss levels are not investment advice or a solicitation to buy or sell any security. Investment decisions and their risks rest solely with the reader.
Track RELX share price daily: live levels, support/resistance and our full RELX analysis history.