Land Securities Share Price Falls 1.21% on Thursday, Up 5.9% in a Month
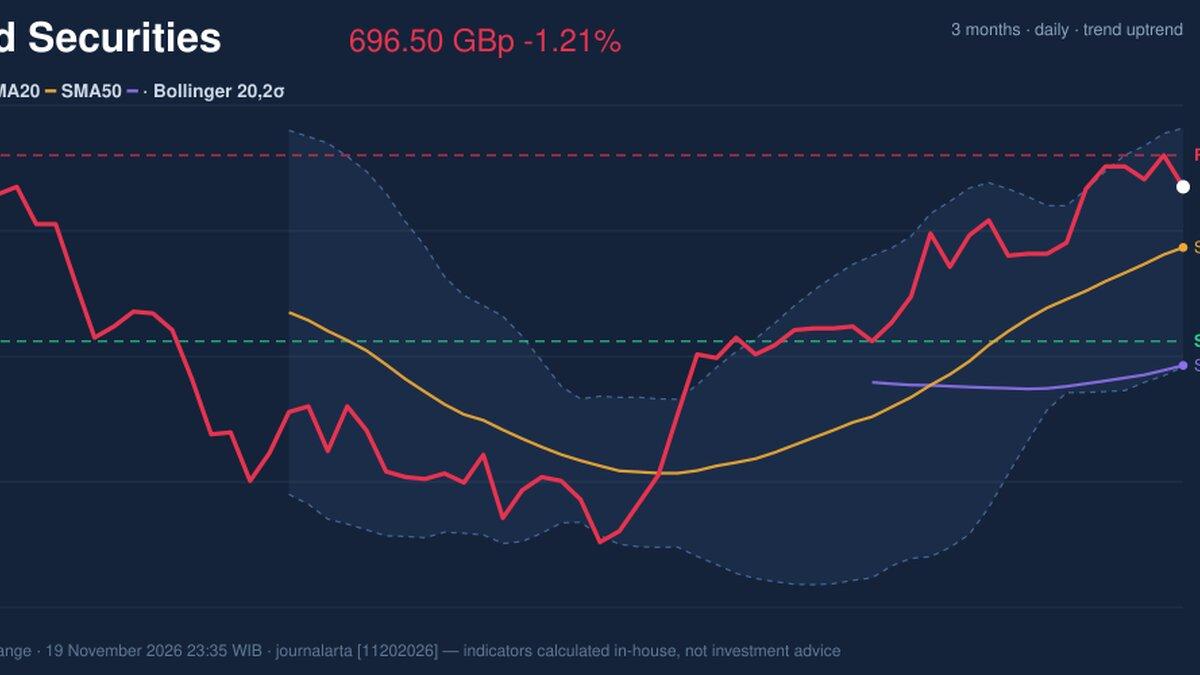
Technical analysis of Land Securities stock on November 19, 2026: price 696.50 GBp, trend uptrend, RSI 64.2, support 655.00, resistance 705.00.
Why Land Securities is in focus today
Selected automatically from 10 LSE (UK) stocks by a technical-signal score with daily weighted randomisation — not a recommendation.
Trend and price action
The structural picture remains firmly constructive. Land Securities trades above its 20-day simple moving average of 680.23 and well above its 50-day average of 648.52, and the stack is correctly ordered, with the shorter average sitting above the longer one. There is no new moving-average crossover to report. The 20-day average itself has been rising, gaining 1.75% over the past five sessions, which matters because it reflects the direction of the trend line under the price, not the stock's own daily move. The session's retreat fits a pattern of a stock pausing after a run. The 83% position within the 20-day range (support at 655.00, resistance at 705.00) places the shares in the upper quarter of their recent band, a zone where sellers tend to appear and buyers tend to wait. The three-month high of 710.00 and low of 597.00 frame the wider recovery: Land Securities has climbed meaningfully off its autumn floor without yet breaking into fresh highs. The dip toward the 20-day average is the kind of test that a healthy uptrend absorbs, and the fact that the price closed above that average rather than slicing through it keeps the structure intact.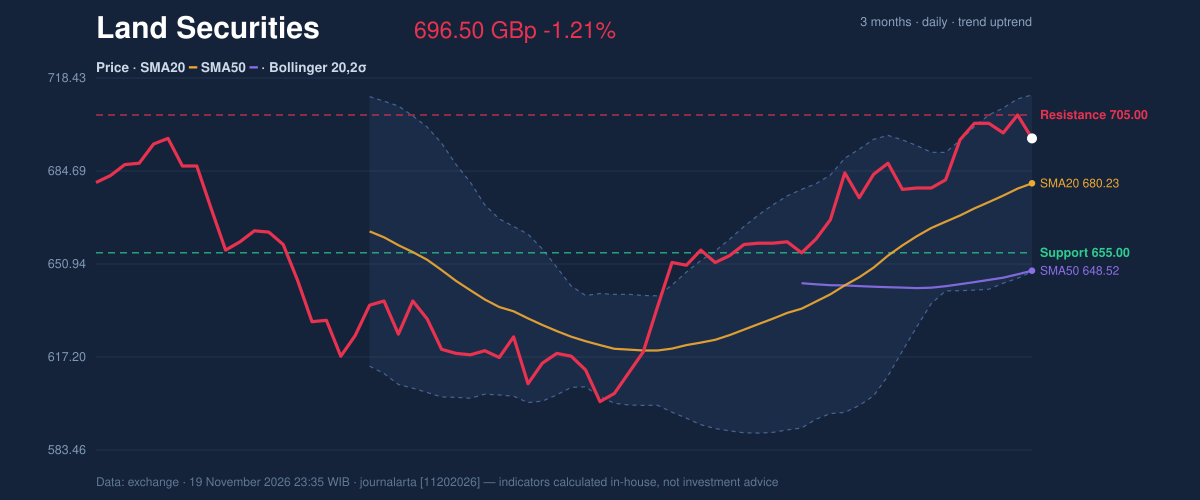
Oscillators and what they signal
Momentum has cooled but not broken. The 14-day RSI sits at 64.2, in neutral territory, after having been above 65 — a slight rollover that is exactly the sort of early warning the technical signals flag as bearish. Read carefully, that signal is about pace, not direction. An RSI easing from the high-60s while price holds above its averages is what deceleration looks like in a market that has moved a long way in a month. The stochastic tells a similar story of a pause rather than a reversal: %K is at 70.7 and %D at 80.0, the faster line already dipping below the slower one, again neutral. Where the two short-term measures soften, the MACD remains positive: the line reads 14.461 against a signal of 13.386, leaving a histogram of 1.075. The longer-horizon momentum gauge is still expanding, which argues that the underlying impulse has not turned. The disagreement between a fading RSI and a firm MACD is the central tension of this chart, and in an established uptrend the slower indicator usually carries the structural argument.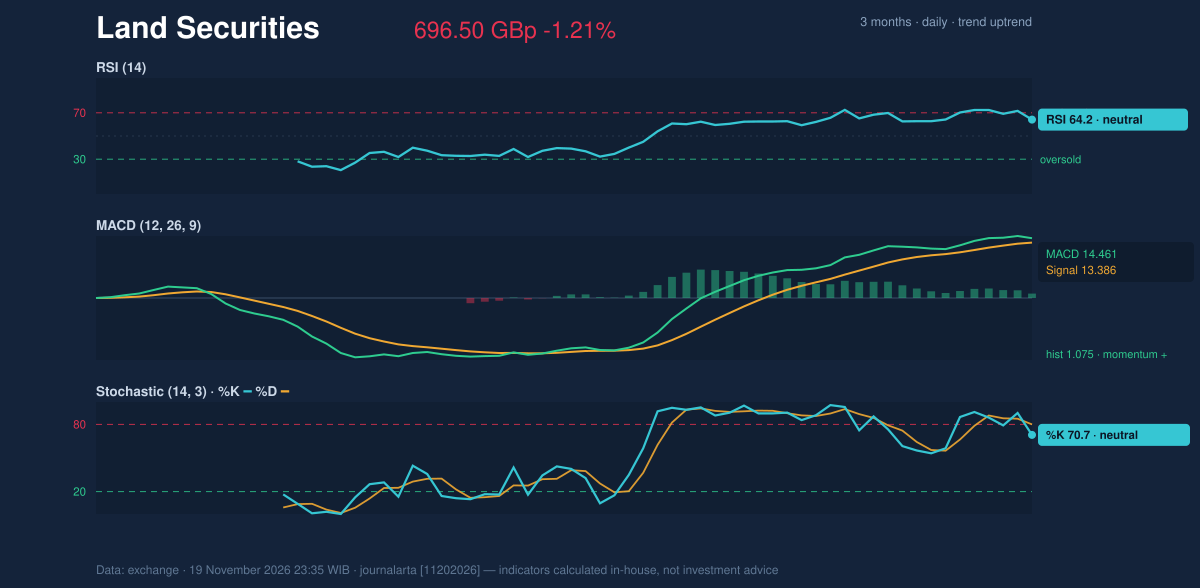
Volatility and volume
The Bollinger envelope is behaving normally. The bands span 712.29 at the top and 648.16 at the bottom around a 680.23 midpoint, a width of 9.4%, and the price sits at 75% of the band (%B), nearer the upper edge. That positioning is consistent with a stock nudging at resistance, though it leaves room before the stock would look stretched. The ATR of 15.05, equal to 2.2% of the price, describes moderate daily movement, so the 8.50 GBp decline in this session is comfortably inside a normal day's swing. Volume gives the day much of its meaning. The 2,182,548 shares traded came in at roughly 0.8 times the 20-day average of 2,671,702 — the textbook profile of a pullback on thin participation. When sellers cannot muster average volume while price slips, the move carries less conviction than the percentage suggests. The on-balance volume line, meanwhile, continues to rise, confirming that the cumulative flow of shares has been into stronger hands across the advance. Together, the light session and the rising OBV support the interpretation of a pause, not a distribution.Key levels and scenarios
The immediate test is 705.00, the 20-day resistance, with the Bollinger top at 712.29 and the three-month high of 710.00 clustered just beyond. A decisive close above 705.00 would signal that the pause has resolved upward and re-open the path toward the upper band, though the thin volume means such a break would need stronger participation to be trusted. To the downside, the 20-day average at 680.23 is the first line of defence; the session's low held it. If that gives way, the 655.00 support and the Bollinger lower band at 648.16 sit just above the 50-day average, marking the zone where the trend's integrity would be genuinely questioned. The RSI rollover is the specific indicator to watch here: if it accelerates sharply below the neutral mid-50s while price loses 680, the current interpretation would need revisiting.Technical Verdict: BUY
The evidence supports BUY, aligned with the JournalArta research score of +76 on a −100 to +100 scale, built on price above the 50-day average, a 20-day average above the 50-day, an uptrend, and an RSI of 64.2 within the 50–70 zone. - Price sits above both moving averages with a rising 20-day trend line and a positive MACD histogram (1.075), confirming trend and momentum. - The pullback came on 0.8× normal volume with a rising OBV, a classic sign of consolidation rather than reversal. - The RSI rollover from above 65 is the main risk and is treated as a timing caution, not an invalidation. Ideal entry range: 685.22 – 696.50 GBp. Exit targets: 734.87 GBp and 773.24 GBp. Stop loss: 670.92 GBp. Reward-to-risk is 1.5 to 3.0, and the view is valid until 17 December 2026. The verdict is invalidated if the price breaks below 670.92. In plain English: the trend is still up, the recent dip looks like a rest rather than a retreat, and the main risk is that momentum keeps cooling. "We're seeing a stock take a breath on light volume — the buyers haven't left the building, they've just stepped back from the counter," said one London-based market analyst.Summary Data Land Securities
| Last price | 696.50 GBp |
| Change 1 day / 5 days / 1 month | -1.21% / 0.07% / 5.85% |
| Trend / MA-cross | uptrend / none |
| SMA20 / SMA50 | 680.23 / 648.52 |
| RSI (14) / Stochastic %K | 64.2 / 70.7 |
| Bollinger %B / ATR | 75% / 15.05 |
| Support / Resistance 20 days | 655.00 / 705.00 |
| Data as of | 19 November 2026 23:35 WIB |
| JournalArta research verdict (score) | Buy (+76) |
| Entry zone | 685.22 – 696.50 |
| Target 1 / 2 | 734.87 / 773.24 |
| Stop loss | 670.92 |
| Reward/risk | 1.5 / 3.0 |
Today's full Buy and Sell list for UK, Singapore & Hong Kong stocks →
Disclaimer: This technical analysis is generated automatically from exchange data and indicators calculated by JournalArta, for information and education only. The verdict and the entry, target and stop-loss levels are not investment advice or a solicitation to buy or sell any security. Investment decisions and their risks rest solely with the reader.
Track Land Securities share price daily: live levels, support/resistance and our full Land Securities analysis history.
 Take the quizWhat Kind of Holiday Spender Are You? Take the Black Friday QuizStart →





 Lifestyle · Food & HealthWhat Is Raynaud’s Syndrome? Why Fingers Turn White in the Cold
 Lifestyle · Food & Health4 Ways Walking After Meals Helps Your Body, Doctors Say
 Lifestyle · Food & Health4 Reasons to Eat Oatmeal, According to Nutrition Experts
 Lifestyle7 Signs Your Social Battery Is Running Low (and Why You Keep Cancelling Plans)