DCC Share Price Little Changed (November 19, 2026): Near a 3-Month High
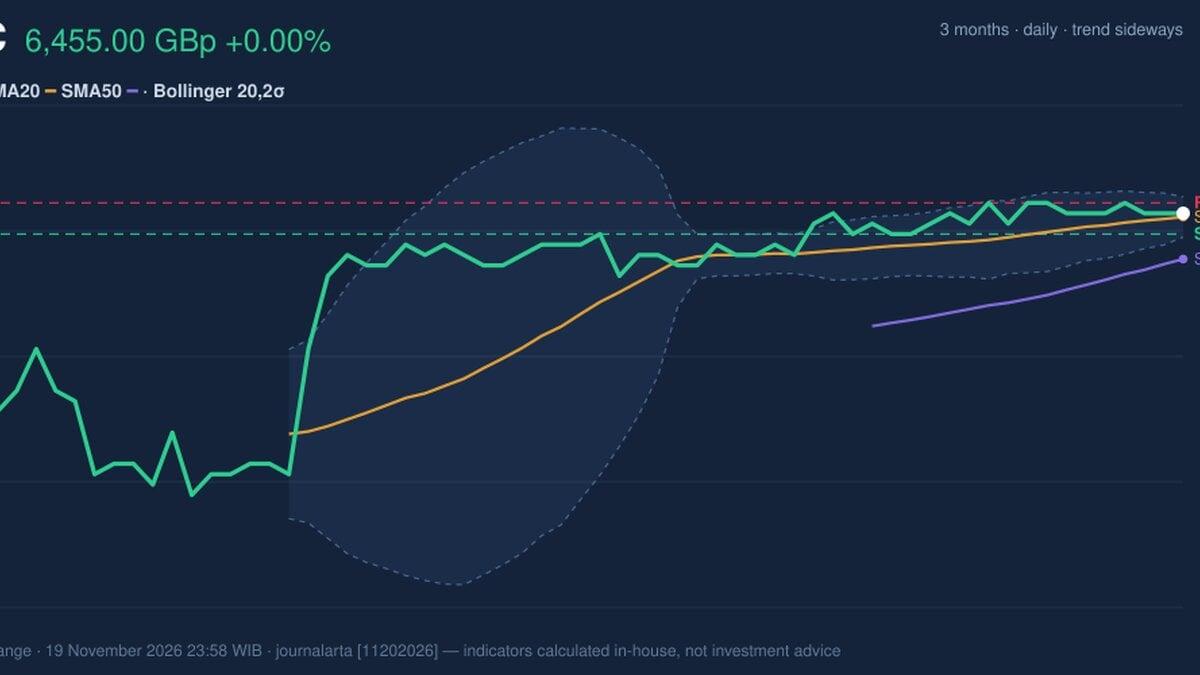
Technical analysis of DCC stock on November 19, 2026: price 6,455.00 GBp, trend sideways, RSI 56.5, support 6,445.00, resistance 6,460.00.
Why DCC is in focus today
- Volume at 0.0× the 20-day average
Selected automatically from 10 LSE (UK) stocks by a technical-signal score with daily weighted randomisation — not a recommendation.
Trend & Price Action
The structure, though quiet, still leans upward. Price sits above the 20-day average (6,453.25) and comfortably above the 50-day at 6,433.10. The 20-day average has crept up 0.07% over five days, and because that average already sits above the 50-day, the medium-term alignment remains bullish. No fresh moving-average cross has formed, so there is no new signal to trade — only an established backdrop. Position within the range reinforces the muted picture. At 6,455.00 the stock sits at 67% of the 20-day range between support at 6,445.00 and resistance at 6,460.00 — a 15-point band. Over three months the extremes are 6,315.00 and 6,475.00, leaving the price closer to the top than the bottom of that wider frame, but without the thrust that usually accompanies a breakout attempt.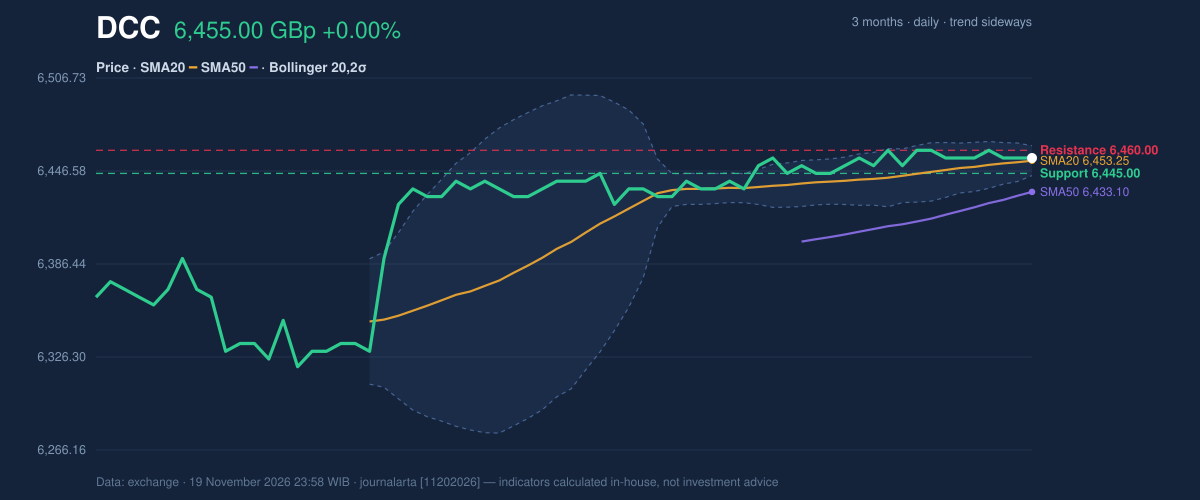
Oscillators & Momentum
Momentum is where the bullish trend and the daily tape disagree. RSI(14) at 56.5 is neutrally constructive — in the 50–70 zone, neither stretched nor weak. Stochastic %K and %D both sit at 33.3, equally neutral, and notably below the level that would flag exhaustion. Neither oscillator is arguing against the trend. MACD is the exception. At 6.850 against a signal line of 8.395, the histogram reads −1.545, a negative momentum reading even as price holds above its moving averages. Read plainly, the trend is intact but the short-term push has faded — consistent with a stock consolidating sideways rather than advancing.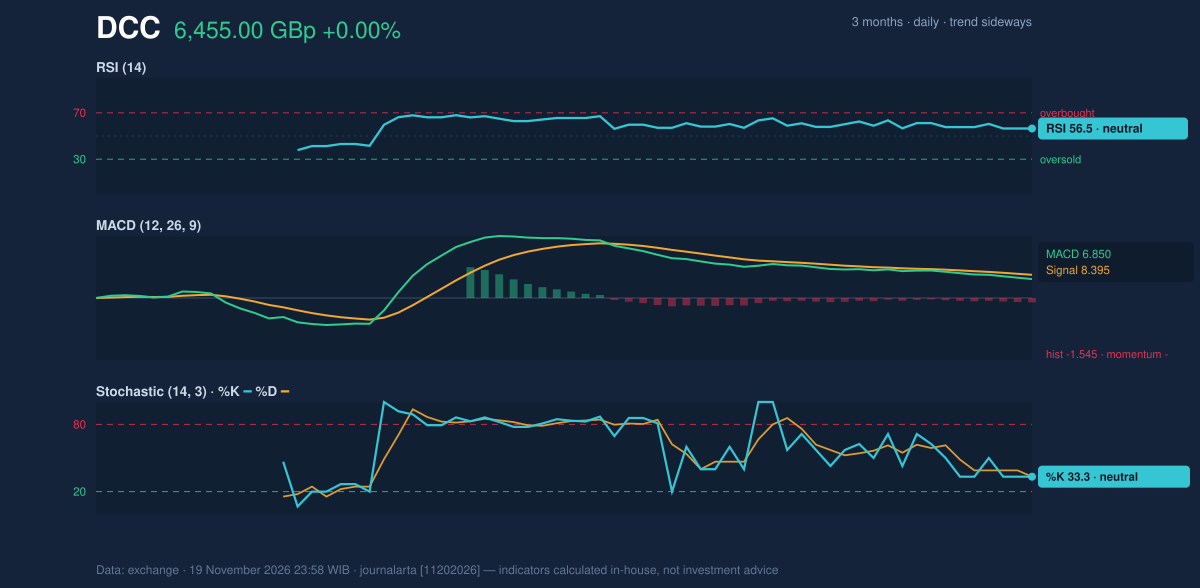
Volatility, Volume & Levels
ATR(14) at 15.36 GBp — just 0.2% of the price — confirms exceptionally low volatility. Combined with the band squeeze, the setup is asymmetric in time if not yet in direction: quiet now, with room for a sharper move once the 6,443.62–6,462.88 envelope is breached. The levels are tight enough to be actionable. A close above 6,460.00 would put the stock against the three-month high of 6,475.00, with the upper band at 6,462.88 as the first gate. Failure to hold 6,445.00 opens the lower band at 6,443.62 and then the 50-day at 6,433.10 — the line that, if lost, would undermine the current bullish alignment.Technical Verdict: BUY
The JournalArta research score stands at +61 on a −100 to +100 scale, above the +60 buy threshold, driven by price above the 50-day average, the 20-day average above the 50-day, RSI at 56.5, and one bullish signal — a pullback to the 20-day average within an uptrend — against zero bearish signals. Three reasons carry the call: the moving-average stack remains bullish with price above both averages; RSI at 56.5 leaves room before overbought conditions; and the Bollinger squeeze at 0.3% width favours eventual expansion in the direction of trend. The negative MACD histogram and falling OBV are the risks to watch, not reasons to abandon the setup. - Entry Range: 6,445.00 – 6,455.00 - Exit Target: 6,494.51 (target 1); 6,534.02 (target 2) - Stop Loss: 6,428.66 - Reward/Risk: 1.5 / 3.0 - Validity: until 17 December 2026 - Invalidation: a close below 6,428.66 breaks the 50-day structure and voids the verdict. In plain terms: the trend still points higher, and the tight range offers a defined entry with a defined exit — but the fading MACD and soft OBV mean patience, not conviction, is the appropriate posture. The setup remains valid until 17 December 2026, the date on which the current entry, target and stop levels expire.Summary Data DCC
| Last price | 6,455.00 GBp |
| Change 1 day / 5 days / 1 month | 0.00% / 0.00% / 0.31% |
| Trend / MA-cross | sideways / none |
| SMA20 / SMA50 | 6,453.25 / 6,433.10 |
| RSI (14) / Stochastic %K | 56.5 / 33.3 |
| Bollinger %B / ATR | 59% / 15.36 |
| Support / Resistance 20 days | 6,445.00 / 6,460.00 |
| Data as of | 19 November 2026 23:58 WIB |
| JournalArta research verdict (score) | Buy (+61) |
| Entry zone | 6,445.00 – 6,455.00 |
| Target 1 / 2 | 6,494.51 / 6,534.02 |
| Stop loss | 6,428.66 |
| Reward/risk | 1.5 / 3.0 |
Today's full Buy and Sell list for UK, Singapore & Hong Kong stocks →
Disclaimer: This technical analysis is generated automatically from exchange data and indicators calculated by JournalArta, for information and education only. The verdict and the entry, target and stop-loss levels are not investment advice or a solicitation to buy or sell any security. Investment decisions and their risks rest solely with the reader.
Track DCC share price daily: live levels, support/resistance and our full DCC analysis history.
 Take the quizWhat Kind of Holiday Spender Are You? Take the Black Friday QuizStart →





 Lifestyle · Food & HealthWhat Is Raynaud’s Syndrome? Why Fingers Turn White in the Cold
 Lifestyle · Food & Health4 Ways Walking After Meals Helps Your Body, Doctors Say
 Lifestyle · Food & Health4 Reasons to Eat Oatmeal, According to Nutrition Experts
 Lifestyle7 Signs Your Social Battery Is Running Low (and Why You Keep Cancelling Plans)