Marks and Spencer Share Price Falls 1.23% on Thursday, Up 8.4% in a Month
Technical analysis of M&S stock on November 19, 2026: price 457.90 GBp, trend uptrend, RSI 64.1, support 404.00, resistance 470.80.

Why M&S is in focus today
Selected automatically from 10 LSE (UK) stocks by a technical-signal score with daily weighted randomisation — not a recommendation.
Trend and Price Action
The moving-average structure is unambiguous. Price sits above both the 20-day and 50-day averages, and the 20-day average itself sits above the 50-day, the classic alignment of a sustained advance. There is no fresh moving-average cross in the data; this is an established trend, not a new signal. The Bollinger bands frame the same picture with more texture. The 20-day middle band coincides with the 20-day average at 437.40, the upper band is at 482.02 and the lower at 392.77. The last close is below the upper band — %B at 73% — meaning the stock has eased off the ceiling without surrendering the middle of the range. Band width has widened to 20.4%, a sign that day-to-day swings have grown. For a general reader, that simply means the stock is moving around more than usual, so support and resistance levels matter more than they did during the calmer stretch.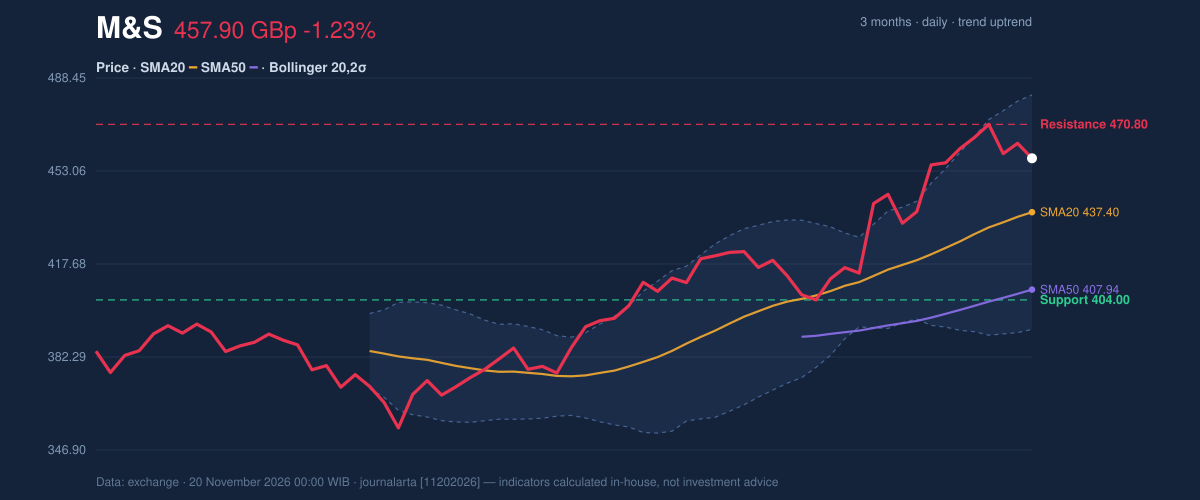
Oscillators and Momentum
Momentum is where the two sides of this stock meet. RSI(14) at 64.1 sits in the neutral band but just below the 65 mark, and the data flags it as rolling over from above that threshold. That is the one bearish signal in the set: momentum has cooled from a stronger reading, which is typical of a stock digesting a rally rather than collapsing. Stochastic readings confirm the cooling. %K is 76.6 and %D is 80.0 — neutral, but with the faster line below the slower one, consistent with a short-term stall. MACD tells the opposite story: the line at 16.130 holds above its signal at 14.899, with a positive histogram of 1.231. Trend-following momentum remains intact even as the faster oscillators flatten. The divergence between MACD and RSI is the key reading: the medium-term engine is still running, while the short-term gauges take a breather.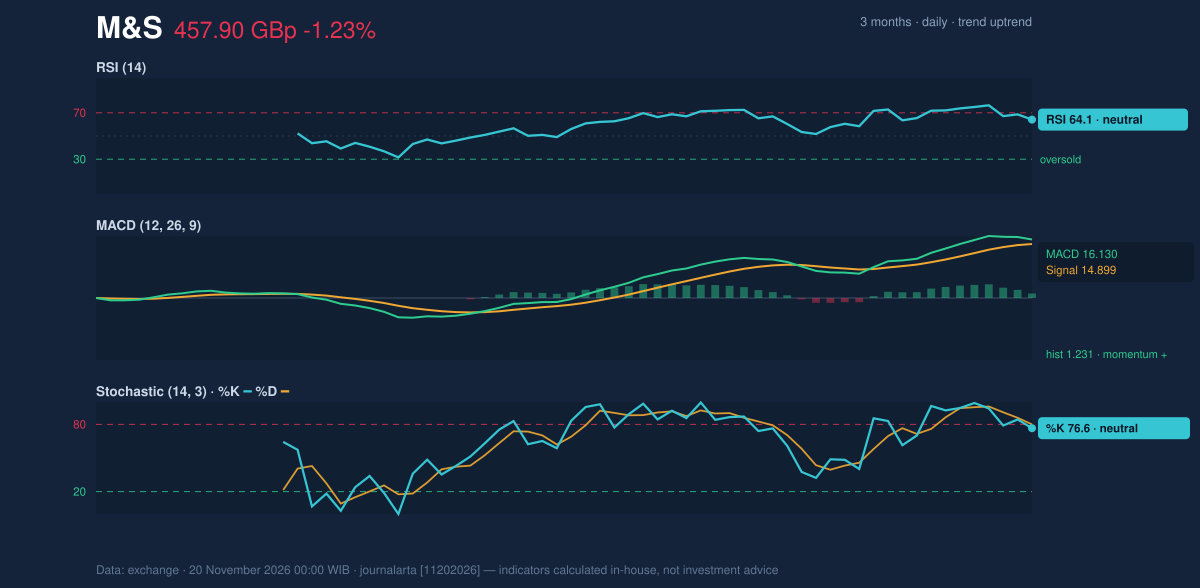
Volatility and Risk
ATR(14) stands at 14.39, or 3.1% of the price — moderate volatility. In plain terms, a typical session now moves the stock about 14.4 pence. Combined with the wider Bollinger bands, that argues for patience with normal noise: a drop toward the 20-day average would be an ordinary move in this volatility regime, not a warning.Key Levels and Scenarios
The line to watch is the 20-day average at 437.40, sitting just above the 20-day support at 404.00. If the price retreats to the average and holds, the structure of higher highs and higher lows stays intact. If it fails there and breaks 404.00, the recent range starts to look like a top rather than a pause. On the upside, resistance sits at 470.80, just under the three-month high of 475.00; a clean break above that would reopen the upper Bollinger band at 482.02 as the next reference point.Technical Verdict: BUY
The computed JournalArta verdict is BUY, with a score of +66 on a −100 to +100 scale where +60 or above is the buy threshold. Three factors carry it: price above the 50-day average, the 20-day average above the 50-day, and RSI at 64.1 in the 50–70 zone. The rising on-balance volume confirms participation, and the pullback to the 20-day average within an uptrend is itself a bullish setup. The one risk to name is RSI rolling over from above 65 — if that cooling deepens, the stock could drift toward the average before buyers return. The verdict is invalidated if price breaks below 433.45. - Entry range: 447.12 – 457.90 - Exit target 1: 494.57; target 2: 531.25 - Stop loss: 433.45 - Reward-to-risk: 1.5 to 3.0 In everyday terms: the trend and the buying are still pointing up, and the recent dip is the kind of quiet pause a rising stock often takes before its next move. The setup remains valid until December 18, 2026.| Indicator | Reading | Signal |
|---|---|---|
| Last price | 457.90 GBp | Down 1.23% on the day, up 8.40% on the month |
| 20-day / 50-day average | 437.40 / 407.94 | Price above both; uptrend |
| Bollinger (20,2σ) | 482.02 / 437.40 / 392.77 | %B 73%; bands widening |
| RSI(14) | 64.1 | Neutral, rolling over from above 65 |
| Stochastic | %K 76.6 / %D 80.0 | Neutral |
| MACD | 16.130 vs signal 14.899 | Positive momentum |
| ATR(14) | 14.39 (3.1%) | Moderate volatility |
| Volume / 20-day average | 11,612,870 / 8,083,041 | 1.4× normal; OBV rising |
| Support / resistance (20-day) | 404.00 / 470.80 | Price at 81% of range |
Summary Data M&S
| Last price | 457.90 GBp |
| Change 1 day / 5 days / 1 month | -1.23% / -0.80% / 8.40% |
| Trend / MA-cross | uptrend / none |
| SMA20 / SMA50 | 437.40 / 407.94 |
| RSI (14) / Stochastic %K | 64.1 / 76.6 |
| Bollinger %B / ATR | 73% / 14.39 |
| Support / Resistance 20 days | 404.00 / 470.80 |
| Data as of | 20 November 2026 00:00 WIB |
| JournalArta research verdict (score) | Buy (+66) |
| Entry zone | 447.12 – 457.90 |
| Target 1 / 2 | 494.57 / 531.25 |
| Stop loss | 433.45 |
| Reward/risk | 1.5 / 3.0 |
Today's full Buy and Sell list for UK, Singapore & Hong Kong stocks →
Disclaimer: This technical analysis is generated automatically from exchange data and indicators calculated by JournalArta, for information and education only. The verdict and the entry, target and stop-loss levels are not investment advice or a solicitation to buy or sell any security. Investment decisions and their risks rest solely with the reader.
Track M&S share price daily: live levels, support/resistance and our full M&S analysis history.
 Take the quizWhat Kind of Holiday Spender Are You? Take the Black Friday QuizStart →





 Lifestyle · Food & HealthWhat Is Raynaud’s Syndrome? Why Fingers Turn White in the Cold
 Lifestyle · Food & Health4 Ways Walking After Meals Helps Your Body, Doctors Say
 Lifestyle · Food & Health4 Reasons to Eat Oatmeal, According to Nutrition Experts
 Lifestyle7 Signs Your Social Battery Is Running Low (and Why You Keep Cancelling Plans)