Insurance Australia Share Price Latest: Little Changed on Thursday, Up 1.3% in a Month
Technical analysis of IAG stock on November 19, 2026: price 9.01 AUD, trend uptrend, RSI 62.5, support 8.61, resistance 9.10.
Why IAG is in focus today
Selected automatically from 8 ASX (Australia) stocks by a technical-signal score with daily weighted randomisation — not a recommendation.
Trend & Price Action
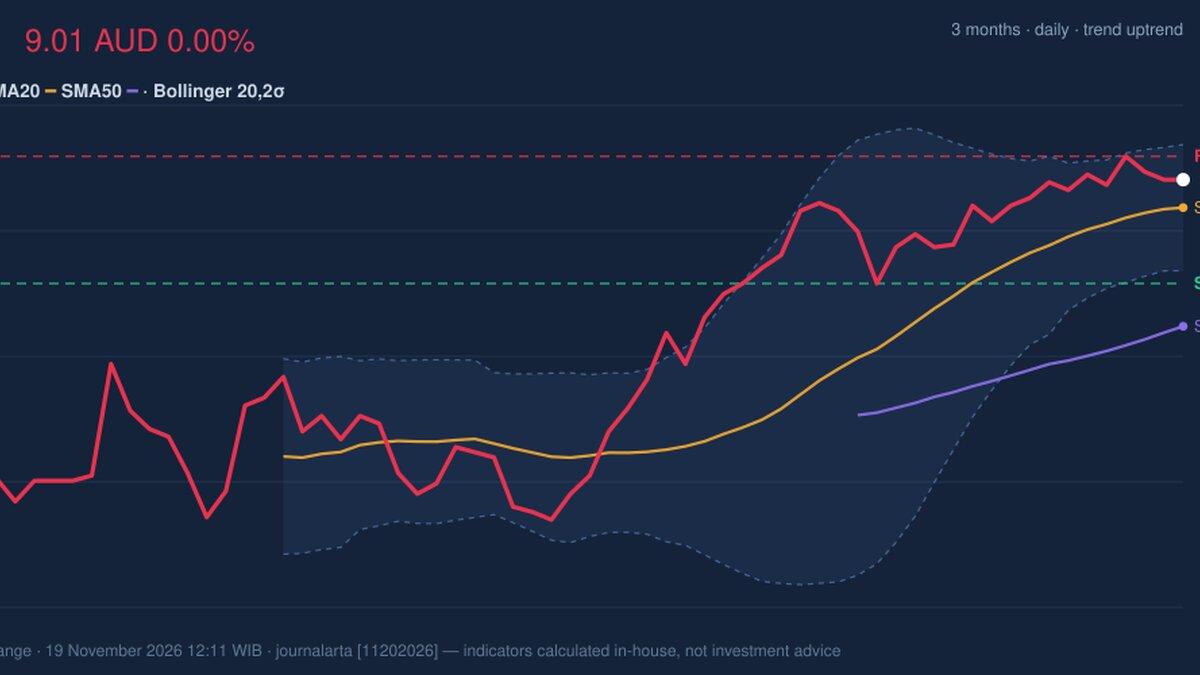
The primary signal is structural. The last price of A$9.01 trades above the 20-day average of A$8.90 and well above the 50-day average of A$8.45. That ordering — price on top, then the short average, then the long average — is the classic definition of a rising trend. The 20-day average itself has been climbing, up 0.96% over the past five sessions, which means the trend is being renewed rather than merely inherited. There is no fresh moving-average crossover to report. That is not a bearish fact; it is simply that the golden-cross setup already happened earlier in the recovery, and the market is now living with the consequence. Traders watching for a new entry trigger would have to wait. What they have instead is confirmation that the trend structure has held through the modest five-day pullback. The proximity to the A$9.10 20-day resistance is the central tension. The stock has approached that level without yet clearing it, and the push into the top of the range reflects genuine buyer interest rather than a sudden spike.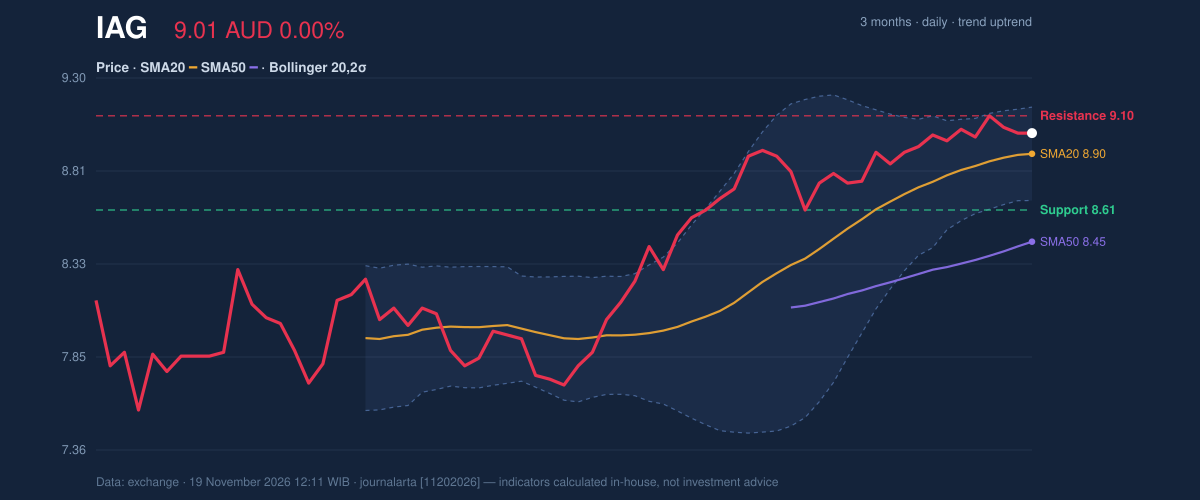
Oscillators & Momentum
Momentum is the softer part of the picture, and it deserves a careful reading rather than a dismissive one. The 14-day RSI sits at 62.5 — in the neutral zone, below the 70 threshold that would flag overheating, but above 50, which keeps the directional bias positive. Importantly, the code flags that this RSI has been rolling over from above 65. That is a cooling pattern, not a reversal. An RSI easing from the high 60s while price holds near its highs often signals consolidation before another leg, but it can also precede a dip. The same message comes from the stochastic measures: %K at 69.4 and %D at 72.9. Both are neutral, both are clustered near each other, and neither is issuing a decisive cross. Meanwhile the MACD is the one clear negative note in the momentum suite: the line at 0.166 sits below its signal at 0.181, leaving the histogram at -0.016. That is a mild bearish configuration — enough to say momentum is fading, not enough to say the trend has turned. The honest synthesis: price and trend indicators are aligned upward, momentum indicators are mixed, and the divergence is the pullback within an intact uptrend.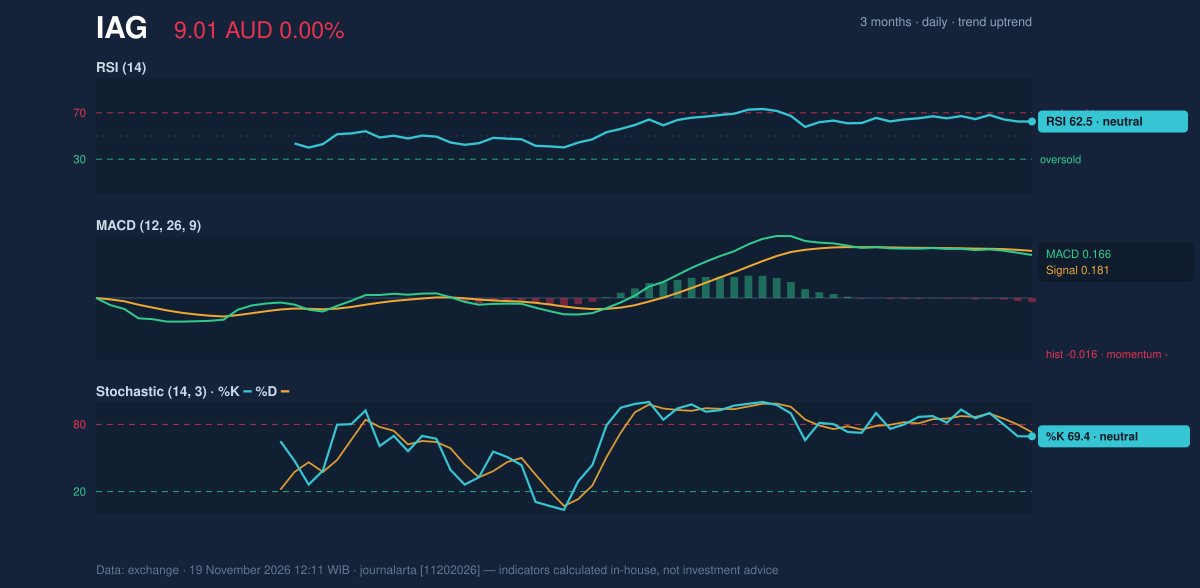
Volatility & Volume
Bollinger bands frame the opportunity. The upper band at A$9.15, the middle at A$8.90 and the lower at A$8.66 give a band width of 5.5%, and the data explicitly describes the bands as narrowing — a squeeze that historically precedes a breakout in either direction. The %B reading of 72% places the price in the upper third of the band but not against the cap, leaving room before the upper band is tested. Volatility itself is moderate. The ATR of 0.17, or 1.9% of the price, suggests daily swings of roughly that magnitude are normal, which matters for anyone judging whether a move through resistance is genuine or just noise. Volume leans constructive. The latest session's 5,844,659 shares ran at 1.1 times the 20-day average of 5,552,488, so participation firmed as the stock held its ground. More tellingly, on-balance volume is rising — the cumulative tally of buying pressure is trending higher even as the headline price stalls. That combination, flat price with rising OBV, usually reflects accumulation rather than distribution.Key Levels & Scenarios
The reference points are concrete. Support sits at A$8.61 from the 20-session range, with the 20-day average at A$8.90 acting as the first line of defence beneath the price and the lower Bollinger band at A$8.66 reinforcing the deeper support zone. On the upside, resistance is A$9.10, with the three-month high of A$9.16 just beyond it. If the stock clears A$9.10 with convincing volume, the path toward the upper band and the three-month high opens, and the narrowing bands suggest the resolution could be sharp when it comes. If it fails to hold the 20-day average at A$8.90, the attention shifts to A$8.61 and then the 50-day average at A$8.45, which remains the line separating a pullback from a trend break.Technical Verdict: BUY
The weight of evidence favours the upside. First, the trend structure is clean: price above the 50-day average, the 20-day average above the 50-day, and the 20-day average itself rising at 0.96% per five sessions. Second, the pullback has been shallow and orderly — the stock is testing its 20-day average within an uptrend rather than breaking down through it, and rising OBV confirms buyers are absorbing supply. Third, the RSI at 62.5 leaves headroom before overbought conditions; the momentum cooling is consolidation, not distribution. The case is not airtight. The MACD histogram at -0.016 and the RSI's rollover from above 65 are genuine warning signs of fading near-term momentum, and a decisive break below the 20-day average would put the verdict on notice. Formal invalidation comes at the stop level of A$8.71, below which the setup no longer holds. - Entry range: A$8.89 – A$9.01 - Exit targets: A$9.46 (first), A$9.91 (second) - Stop loss: A$8.71 - Reward/risk: 1.5 to 3.0 - Signal valid until: 17 December 2026 In plain English: the trend and buying pressure point higher, but the trade only works while the stock keeps its footing just below A$9.Market Data Snapshot
| Metric | Value |
|---|---|
| Last price | A$9.01 |
| 1-day / 5-day / 1-month change | 0.00% / -0.22% / +1.35% |
| SMA20 / SMA50 | A$8.90 / A$8.45 |
| Bollinger (20, 2σ) | Upper A$9.15 / Mid A$8.90 / Lower A$8.66 |
| Bollinger %B / width | 72% / 5.5% (narrowing) |
| RSI(14) / Stochastic %K / %D | 62.5 / 69.4 / 72.9 |
| MACD / signal / histogram | 0.166 / 0.181 / -0.016 |
| ATR(14) | 0.17 (1.9% of price) |
| Volume vs 20-day average | 5,844,659 vs 5,552,488 (1.1×) |
| 20-session support / resistance | A$8.61 / A$9.10 |
| 3-month high / low | A$9.16 / A$7.50 |
| OBV | Rising |
| Session | Thursday, November 19, 2026 |
Summary Data IAG
| Last price | 9.01 AUD |
| Change 1 day / 5 days / 1 month | 0.00% / -0.22% / 1.35% |
| Trend / MA-cross | uptrend / none |
| SMA20 / SMA50 | 8.90 / 8.45 |
| RSI (14) / Stochastic %K | 62.5 / 69.4 |
| Bollinger %B / ATR | 72% / 0.17 |
| Support / Resistance 20 days | 8.61 / 9.10 |
| Data as of | 19 November 2026 12:11 WIB |
| JournalArta research verdict (score) | Buy (+66) |
| Entry zone | 8.89 – 9.01 |
| Target 1 / 2 | 9.46 / 9.91 |
| Stop loss | 8.71 |
| Reward/risk | 1.5 / 3.0 |
Today's full Buy and Sell list for Australian stocks (ASX) →
Disclaimer: This technical analysis is generated automatically from exchange data and indicators calculated by JournalArta, for information and education only. The verdict and the entry, target and stop-loss levels are not investment advice or a solicitation to buy or sell any security. Investment decisions and their risks rest solely with the reader.
Track IAG share price daily: live levels, support/resistance and our full IAG analysis history.
 Take the quizWhat Kind of Holiday Spender Are You? Take the Black Friday QuizStart →




 Lifestyle · Food & HealthWhat Is Raynaud’s Syndrome? Why Fingers Turn White in the Cold
 Lifestyle · Food & Health4 Ways Walking After Meals Helps Your Body, Doctors Say
 Lifestyle · Food & Health4 Reasons to Eat Oatmeal, According to Nutrition Experts
 Lifestyle7 Signs Your Social Battery Is Running Low (and Why You Keep Cancelling Plans)