South32 Share Price on Thursday: Tumbles 5.87%, Near a 3-Month Low
Technical analysis of South32 stock on November 19, 2026: price 4.01 AUD, trend downtrend, RSI 32.5, support 4.01, resistance 4.69.
Why South32 is in focus today
- One-day move of 0.00%, about 0.0× its average daily range (ATR)
Selected automatically from 8 ASX (Australia) stocks by a technical-signal score with daily weighted randomisation — not a recommendation.
Trend and Price Action
The structure is unambiguously bearish. At A$4.01, the stock sits below its 20-day simple moving average of A$4.39 and well under the 50-day average at A$4.66, and the shorter average is itself sloping down — the 20-day line has fallen 0.77% over the past five sessions. Notably, there is no fresh moving-average cross to date; the bearish alignment was established earlier and has simply persisted, which is often harder to escape than a single technical event. The position inside the range is the starkest number. Support at the 20-day low of A$4.01 and resistance at A$4.69 put the price at 0% of that band — the floor of the recent range, not the middle of it. The three-month high of A$5.33 now looks distant.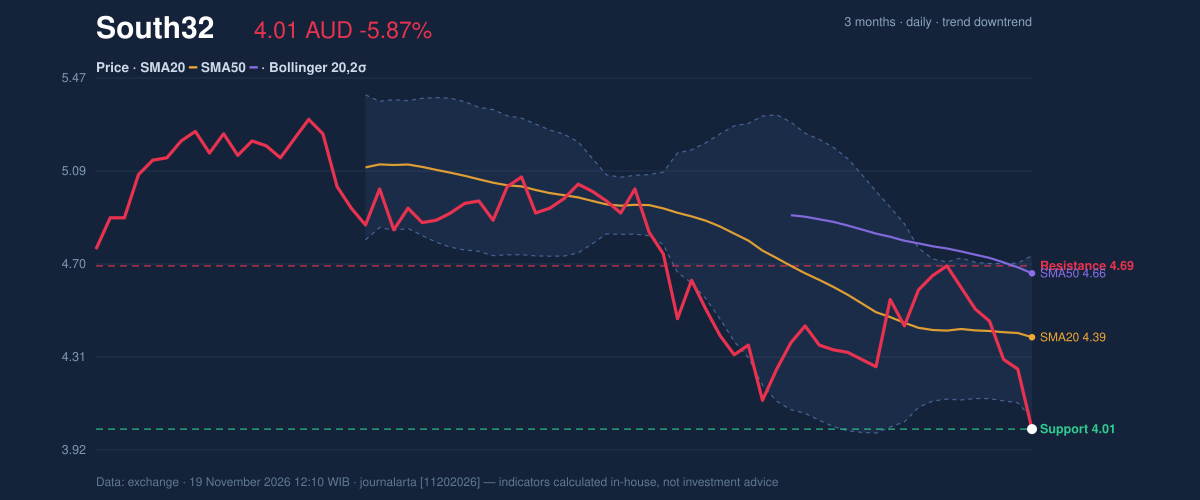
Oscillators and Momentum
Momentum indicators are divided, and the division matters. The 14-day RSI at 32.5 sits in neutral territory — weak, but a whisker above the conventional oversold threshold, so it does not yet argue for a snap-back. The stochastic oscillator is the outlier: %K at 2.7 against %D at 8.3 places it deep in oversold ground, and a spread that wide usually describes a market that has fallen faster than its own short-term average — a setup for a technical bounce, not necessarily a turn. The MACD refuses to cooperate with that hopeful reading. At -0.095 versus a signal line of -0.074, the histogram of -0.021 has just turned negative, confirming that downside momentum is still building rather than exhausting. This is the classic divergence pattern: oversold stochastics warning of a bounce, MACD warning that bounces are for selling.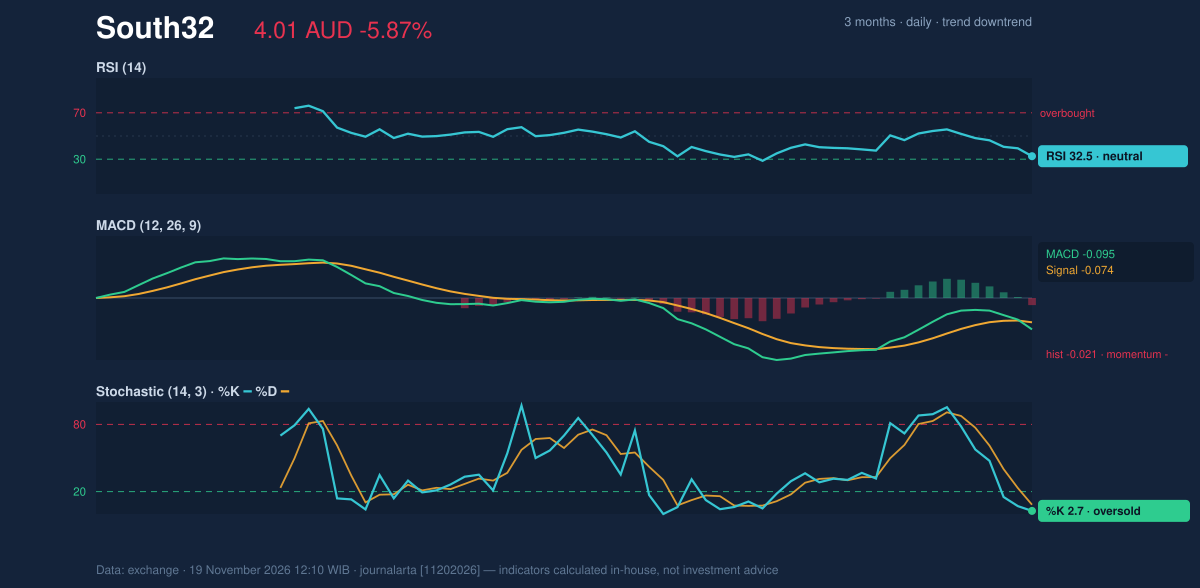
Volatility and Volume
Volatility is wide and honest about it. The average true range of A$0.16 equals 4.1% of the share price — a high reading that tells readers to expect daily swings larger than a typical industrial stock. Bollinger bands, with a normal 15.4% width, run from A$4.05 to A$4.73 around a midpoint of A$4.39. The critical detail is %B, which measures where the price sits within those bands, at -6%. A negative reading means the close is actually below the lower band — a condition that often precedes a relief rally, but in a confirmed downtrend more often signals that momentum is running ahead of the average. Combined with falling OBV and above-average volume, the weight of evidence says distribution, not accumulation.Key Levels and Scenarios
The immediate decision point is the A$4.01 support. A close below it would put the stock in territory not seen since the three-month low of A$3.99, and with no fresh moving-average cross to slow the slide, the path of least resistance remains lower. To the upside, any recovery has to reclaim A$4.39 — the 20-day average and Bollinger midpoint — before the A$4.66 50-day line and the A$4.69 resistance become relevant. A failure to hold A$4.01 would confirm the breakdown; a reclaim of A$4.39 would be the first genuine sign of repair.Technical Verdict: SELL
The JournalArta research model scores South32 at -76 on a -100 to +100 scale, well past the -60 sell threshold, with no bullish signals against two bearish ones. Three reasons carry the call: price is below its 50-day average, the 20-day average sits below the 50-day, and the trend is confirmed by a falling OBV with a freshly negative MACD histogram. The verdict is invalidated if price breaks back above A$4.30, the stop level.- Sell zone: A$4.01 – A$4.13
- Target 1: A$3.58 | Target 2: A$3.14
- Stop loss: A$4.30
- Reward/risk: 1.5 to 3.0 | verdict valid until 17 December 2026
Summary Data South32
| Last price | 4.01 AUD |
| Change 1 day / 5 days / 1 month | -5.87% / -12.83% / -8.03% |
| Trend / MA-cross | downtrend / none |
| SMA20 / SMA50 | 4.39 / 4.66 |
| RSI (14) / Stochastic %K | 32.5 / 2.7 |
| Bollinger %B / ATR | -6% / 0.16 |
| Support / Resistance 20 days | 4.01 / 4.69 |
| Data as of | 19 November 2026 12:10 WIB |
| JournalArta research verdict (score) | Sell (-76) |
| Sell zone | 4.01 – 4.13 |
| Target 1 / 2 | 3.58 / 3.14 |
| Stop loss | 4.30 |
| Reward/risk | 1.5 / 3.0 |
Today's full Buy and Sell list for Australian stocks (ASX) →
Disclaimer: This technical analysis is generated automatically from exchange data and indicators calculated by JournalArta, for information and education only. The verdict and the entry, target and stop-loss levels are not investment advice or a solicitation to buy or sell any security. Investment decisions and their risks rest solely with the reader.
Track South32 share price daily: live levels, support/resistance and our full South32 analysis history.
 Take the quizWhat Kind of Holiday Spender Are You? Take the Black Friday QuizStart →
- 1Brent Crude Slides 4.05% as Rising US Stockpiles Weigh on Oil
- 2UnitedHealth Shares Fall 10.2% Amid Medicare Audit Proposal

- 3PNB Shares Rally 5% as Bank Repeats Loan Growth Target

- 4Stock Market Today: Nasdaq and S&P 500 Futures Rise Ahead of Anthropic Debut

- 5Lainey Wilson and Devlin Hodges Married in Tennessee Cave

 Lifestyle · Food & HealthWhat Is Raynaud’s Syndrome? Why Fingers Turn White in the Cold
 Lifestyle · Food & Health4 Ways Walking After Meals Helps Your Body, Doctors Say
 Lifestyle · Food & Health4 Reasons to Eat Oatmeal, According to Nutrition Experts
 Lifestyle7 Signs Your Social Battery Is Running Low (and Why You Keep Cancelling Plans)