Origin Energy Share Price Falls 1.11% on Thursday, Up 2.7% in Five Sessions
Technical analysis of Origin Energy stock on November 19, 2026: price 12.47 AUD, trend uptrend, RSI 61.8, support 11.99, resistance 12.61.
Why Origin Energy is in focus today
Selected automatically from 8 ASX (Australia) stocks by a technical-signal score with daily weighted randomisation — not a recommendation.
Trend & Price Action
The structural story remains constructive. Origin trades above its 20-day moving average of A$12.24 and well above its 50-day average of A$11.74, a stacking arrangement that typically signals buyers have been in control across both short and medium horizons. There is no fresh moving-average crossover to report — the last one is already behind us — but the 20-day average itself is still rising, climbing 0.81% over the past five days. That gentle upward slope matters: a flattening average would suggest the trend was stalling, while a rising one suggests the base underneath the price is still being lifted. The context is a three-month range of A$10.78 to A$12.69. At A$12.47 the stock sits at roughly 77% of its 20-day range, closer to the ceiling than the floor. That position cuts both ways. It reflects strength, because the price has held near the top of the band, but it also means there is limited room before the stock runs into sellers. The 20-day resistance sits at A$12.61 — precisely the prior close — while support is at A$11.99.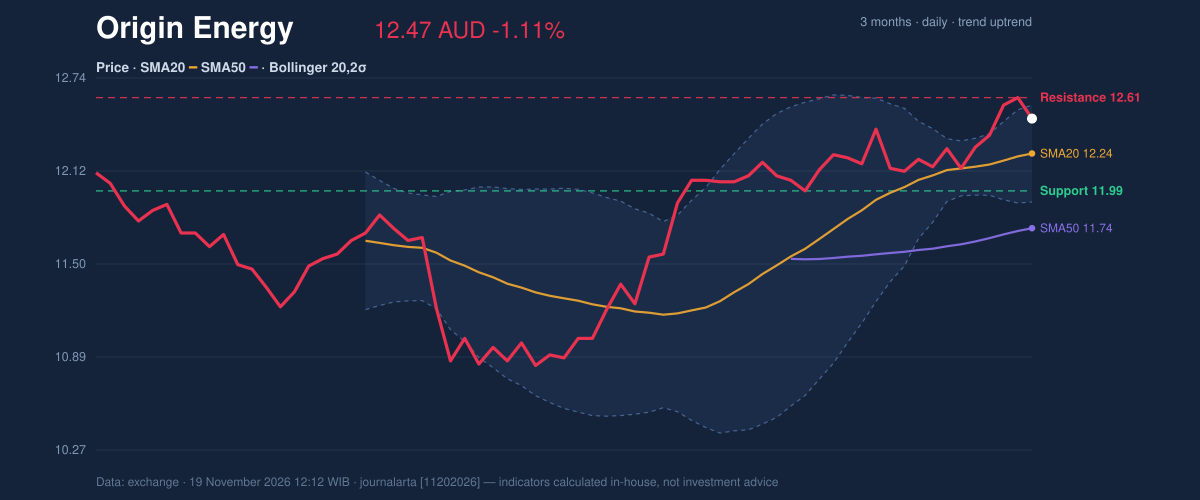
Oscillators & Momentum
Momentum is positive but not stretched. MACD reads 0.194 against a signal line of 0.183, with the histogram at 0.011 — a narrow but positive gap, which is the signature of an uptrend that is intact rather than accelerating. The important detail is that the histogram has only recently turned positive, which the data flags as a bullish signal: momentum is rebuilding after a soft patch. RSI(14) at 61.8 sits in neutral territory, comfortably below the level that would suggest overbought conditions. That is a healthy reading for a stock in an uptrend — strong enough to confirm participation, not so strong that it invites profit-taking. The one caution comes from Stochastic, where %K at 66.7 sits below %D at 84.8, and the data flags RSI rolling over from above 65. Translated from the jargon: the short-term speed of the rally is fading even as the medium-term trend holds. That is a warning about pace, not direction.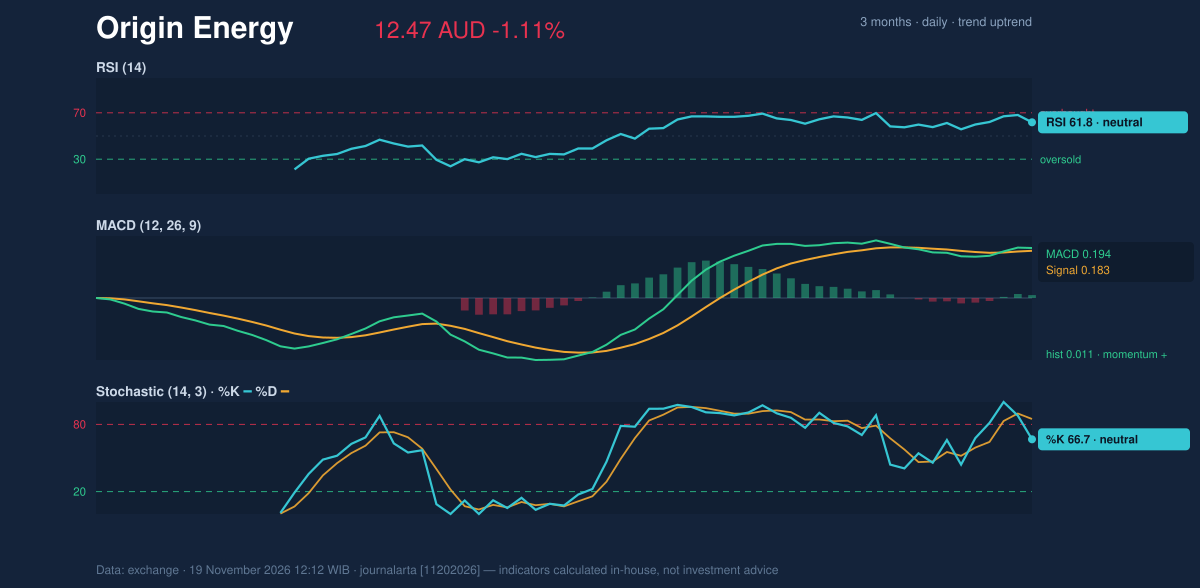
Volatility & Volume
Bollinger bands are unusually tight. The upper band at A$12.56, middle at A$12.24, and lower at A$11.92 give a total width of just 5.3%, which the data describes as a squeeze. Squeezes are not directional signals in themselves — they describe a market that has compressed and is likely to expand. Given that the price is at 86% of the band range (%B), the stock is pressing against the upper band while the band itself narrows, a setup that historically resolves with a sharp move rather than a slow drift. ATR of 0.23, or 1.9% of price, points to moderate volatility. That is not a stock in violent flux; it is a stock where daily swings are contained, which makes the squeeze more meaningful. Volume tells the clearest story. The latest session saw 2.63 million shares trade, just 0.7 times the 20-day average of 3.71 million. A decline on thin volume is the least alarming kind of decline — it suggests absence of selling pressure rather than conviction. Meanwhile, on-balance volume is rising, meaning cumulative buying pressure is still building. Volume and OBV together say participation is light but directional conviction has not flipped.Key Levels & Scenarios
Two prices matter. On the upside, A$12.61 — the 20-day resistance and Thursday's prior close — is the gate. A close above it would put the stock within reach of the three-month high of A$12.69, and clearing that would open the upper band at A$12.56 as the next reference in a fresh expansion. On the downside, A$11.99 is the 20-day support, with the lower band at A$11.92 just beneath it. A break below that zone would put the 50-day average into play and undermine the bullish structure. The most plausible near-term scenario is a retest of A$12.61 on improving volume. The alternative — a failure to hold A$12.24, the 20-day average — would signal the squeeze is resolving downward.Technical Verdict: BUY
The verdict is BUY, supported by a computed score of +84 on a −100 to +100 scale. Three reasons carry it: price sits above its 50-day average in a confirmed uptrend; the MACD histogram has just turned positive; and a pullback to the 20-day average inside that uptrend, backed by rising OBV, is the classic continuation setup. The cautious reading on RSI is a risk, not a disqualifier. - Entry zone: A$12.30 – A$12.47 - Exit target 1: A$13.26 - Exit target 2: A$14.06 - Stop loss: A$11.94 The verdict is invalidated if price breaks below A$11.94. In plain English: the trend is up, the pullback looks like breathing room rather than a breakdown, and the trade works as long as the stock holds above its recent support. *This is technical analysis based on exchange data, not investment advice.*Summary Data Origin Energy
| Last price | 12.47 AUD |
| Change 1 day / 5 days / 1 month | -1.11% / 2.72% / 3.14% |
| Trend / MA-cross | uptrend / none |
| SMA20 / SMA50 | 12.24 / 11.74 |
| RSI (14) / Stochastic %K | 61.8 / 66.7 |
| Bollinger %B / ATR | 86% / 0.23 |
| Support / Resistance 20 days | 11.99 / 12.61 |
| Data as of | 19 November 2026 12:12 WIB |
| JournalArta research verdict (score) | Buy (+84) |
| Entry zone | 12.30 – 12.47 |
| Target 1 / 2 | 13.26 / 14.06 |
| Stop loss | 11.94 |
| Reward/risk | 1.5 / 3.0 |
Today's full Buy and Sell list for Australian stocks (ASX) →
Disclaimer: This technical analysis is generated automatically from exchange data and indicators calculated by JournalArta, for information and education only. The verdict and the entry, target and stop-loss levels are not investment advice or a solicitation to buy or sell any security. Investment decisions and their risks rest solely with the reader.
Track Origin Energy share price daily: live levels, support/resistance and our full Origin Energy analysis history.
 Take the quizWhat Kind of Holiday Spender Are You? Take the Black Friday QuizStart →




 Lifestyle · Food & HealthWhat Is Raynaud’s Syndrome? Why Fingers Turn White in the Cold
 Lifestyle · Food & Health4 Ways Walking After Meals Helps Your Body, Doctors Say
 Lifestyle · Food & Health4 Reasons to Eat Oatmeal, According to Nutrition Experts
 Lifestyle7 Signs Your Social Battery Is Running Low (and Why You Keep Cancelling Plans)