Brambles Share Price Latest: Rises 1.13% on Thursday, Trading Volume 1.6x Normal
Technical analysis of Brambles stock on November 19, 2026: price 22.35 AUD, trend uptrend, RSI 68.2, support 20.97, resistance 22.35.

Why Brambles is in focus today
- Volume at 0.0× the 20-day average
Selected automatically from 8 ASX (Australia) stocks by a technical-signal score with daily weighted randomisation — not a recommendation.
Trend & Price Action
The structural picture is cleanly bullish. The share price trades above both the 20-day average at 21.77 and the 50-day average at 20.26, and the shorter average sits above the longer one — the classic stacking that defines an uptrend. The 20-day average itself has risen 1.94% over the past five days, a slope that tells you the trend is being pulled higher by each session's close, not flattening out. No fresh moving-average cross has formed, which is worth noting: this is an established trend, not a new one being born. What gives the current session weight is where price closed. Sitting at the top of the 20-day range, with the three-month high just above, means buyers absorbed every seller willing to part with stock below 22.35 and still pushed higher on heavy turnover. The 20-day support at 20.97 now sits well below the market — roughly 6% of cushion — which frames the risk if momentum stalls.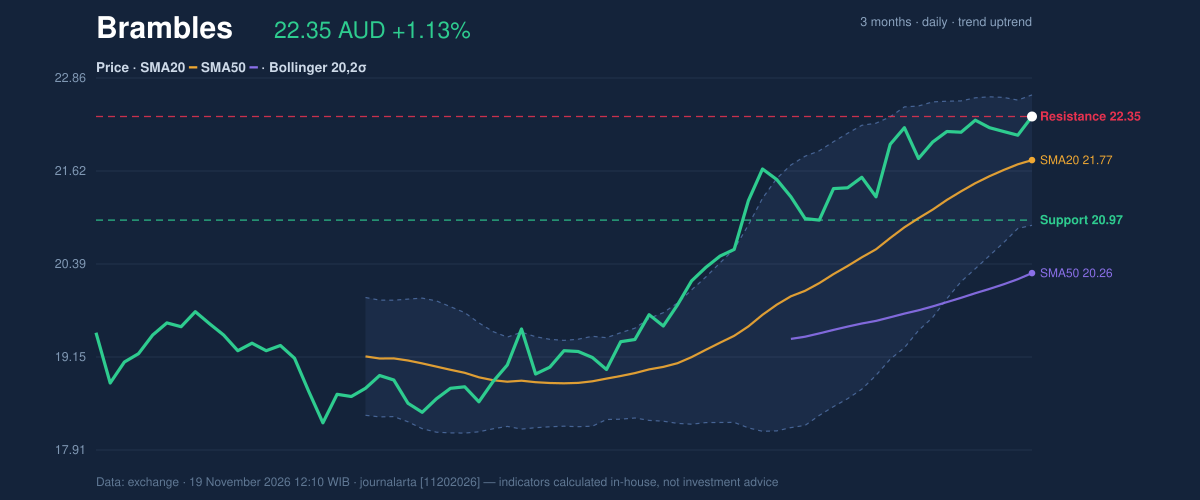
Oscillators & Momentum
Here the picture gets less comfortable. The RSI(14) at 68.2 sits in neutral territory but close to the 70 threshold that conventionally marks overbought. The Stochastic is more stretched: %K at 82.4 against %D at 78.1, firmly in overbought ground. Neither indicator is flashing a sell signal on its own — in strong trends, oscillators can stay elevated for weeks — but they do say the easy part of the move has been captured. The sharper warning comes from MACD. The line at 0.557 has slipped below its signal at 0.589, producing a histogram of −0.032. That is a negative reading, and the code-computed signals flag it as the one bearish technical among seven. Read plainly: the trend is up, but the momentum behind it has decelerated. Price making a new range high while MACD momentum fades is the textbook definition of divergence, and it is the main reason to treat the breakout with discipline rather than enthusiasm.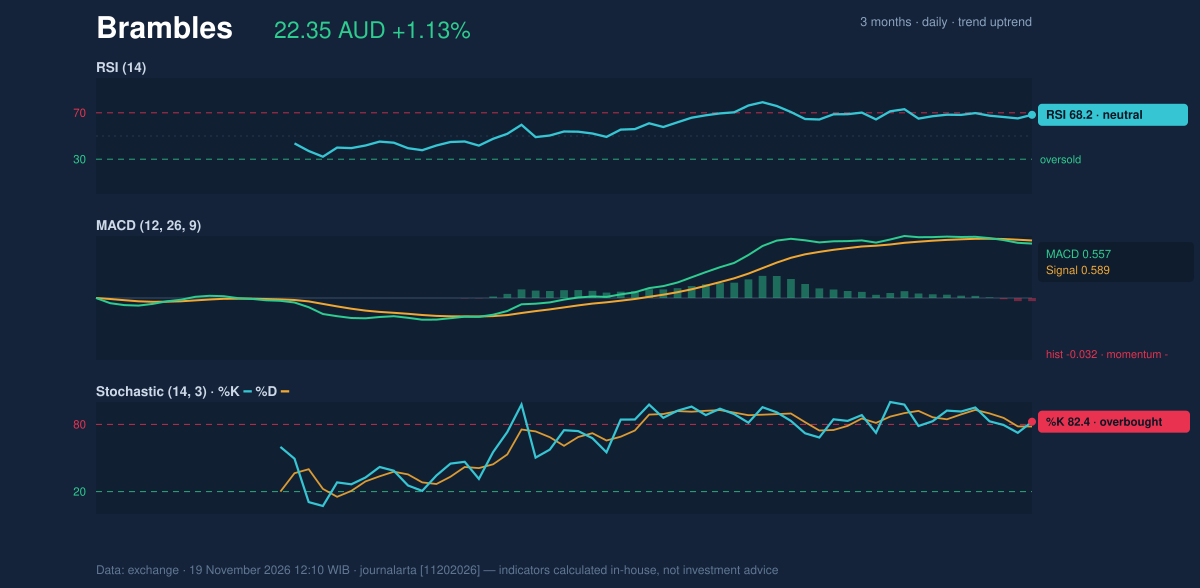
Volatility & Volume
The ATR(14) of 0.41 equates to 1.8% of the share price — moderate volatility. That is useful for sizing: a normal day's range is under half a dollar, so a move to the three-month high or a pullback to the 20-day average both fit within ordinary trading noise. It also means the stop level sits close enough to be practical. Volume is the strongest confirmation in the dataset. The 1.6× surge on a day price cleared resistance is exactly the behaviour technicians want to see — participation expanding as the stock breaks out. The on-balance volume (OBV) is rising, meaning the cumulative volume flow is accumulating on up days rather than distributing. When price, volume and OBV all point the same way, the move carries more credibility than a price-only breakout. One inconsistency in the data deserves mention: the selection signal line records volume at 0.0× the 20-day average, which contradicts the 1.6× figure on the volume line. Treat the detailed 1.6× reading as operative; the 0.0× entry appears to be a data artefact.Key Levels & Scenarios
The immediate test is 22.58, the three-month high. A close above it on continued volume would confirm the squeeze resolution to the upside and open the path toward the targets below. Failure to hold 22.35 — the level just cleared — would return the stock to the upper part of its range and put the breakout on hold. Deeper support sits at 20.97, and a break there would undermine the uptrend structure entirely.Technical Verdict: BUY
The JournalArta research verdict is BUY, scoring +89 on a −100 to +100 scale, with three bullish signals against one bearish. The case rests on three pillars: price above the 50-day average within a confirmed uptrend, a pullback-and-recovery structure that held the 20-day average, and rising OBV confirming accumulation. The verdict is invalidated if price breaks below 21.66. - Entry zone: 22.05 – 22.35 - Target 1: 23.38 | Target 2: 24.42 - Stop loss: 21.66 (reward/risk 1.5 to 3.0) - Valid until: 17 December 2026 The single risk to monitor is the negative MACD histogram; a deepening reading while price stalls below 22.58 would argue for patience rather than action. In plain terms: the trend, the volume and the accumulation all say buyers are in control, but the momentum gauge is tapping the brakes — a breakout that needs one more push to prove itself. This is technical analysis based on the data provided, not an investment recommendation.Summary Data Brambles
| Last price | 22.35 AUD |
| Change 1 day / 5 days / 1 month | 1.13% / 0.95% / 5.28% |
| Trend / MA-cross | uptrend / none |
| SMA20 / SMA50 | 21.77 / 20.26 |
| RSI (14) / Stochastic %K | 68.2 / 82.4 |
| Bollinger %B / ATR | 83% / 0.41 |
| Support / Resistance 20 days | 20.97 / 22.35 |
| Data as of | 19 November 2026 12:10 WIB |
| JournalArta research verdict (score) | Buy (+89) |
| Entry zone | 22.05 – 22.35 |
| Target 1 / 2 | 23.38 / 24.42 |
| Stop loss | 21.66 |
| Reward/risk | 1.5 / 3.0 |
Today's full Buy and Sell list for Australian stocks (ASX) →
Disclaimer: This technical analysis is generated automatically from exchange data and indicators calculated by JournalArta, for information and education only. The verdict and the entry, target and stop-loss levels are not investment advice or a solicitation to buy or sell any security. Investment decisions and their risks rest solely with the reader.
Track Brambles share price daily: live levels, support/resistance and our full Brambles analysis history.
 Take the quizWhat Kind of Holiday Spender Are You? Take the Black Friday QuizStart →




 Lifestyle · Food & HealthWhat Is Raynaud’s Syndrome? Why Fingers Turn White in the Cold
 Lifestyle · Food & Health4 Ways Walking After Meals Helps Your Body, Doctors Say
 Lifestyle · Food & Health4 Reasons to Eat Oatmeal, According to Nutrition Experts
 Lifestyle7 Signs Your Social Battery Is Running Low (and Why You Keep Cancelling Plans)