Land Securities Share Price Latest: Climbs 2.13% on Thursday, Up 1.2% in Five Sessions
Technical analysis of Land Securities stock on November 12, 2026: price 696.00 GBp, trend uptrend, RSI 70.0, support 650.50, resistance 696.00.

London Stock Exchange data for the session of Thursday, November 12, 2026 showed Land Securities Group closing at 696.00 GBp, up 2.13% on the day from a previous close of 681.50. The more telling detail is where that close landed. A Bollinger squeeze, a stretch of unusually tight price ranges, resolved with a close above the upper band, and on-balance volume (OBV) was rising. That combination is why the stock is on the watchlist today.
Why Land Securities is in focus today
- One-day move of 0.00%, about 0.0× its average daily range (ATR)
Selected automatically from 10 LSE (UK) stocks by a technical-signal score with daily weighted randomisation — not a recommendation.
Trend & Price Action
The stock is in an uptrend. It has gained 1.24% over five days and 6.83% over one month. The price sits above both the 20-day average at 668.53 and the 50-day average at 643.61. The gap between the two averages matters because it shows that buyers have been paying progressively higher prices for weeks, not just for one session. The 20-day average itself rose 2.22% over five days. DATA shows no new moving-average cross, so the bullish alignment of the averages is an established feature of the chart and not a fresh trigger.
As shown in the chart below, the close of 696.00 pushed through the upper Bollinger band at 695.80, which puts the %B reading at 100%. Bollinger bands are drawn two standard deviations around the 20-day average. A close at or above the upper edge says the move is unusually strong relative to recent history. Band width stood at 8.2%, which DATA classes as normal. The earlier squeeze has therefore already released its energy upward, and the bands are no longer coiled.
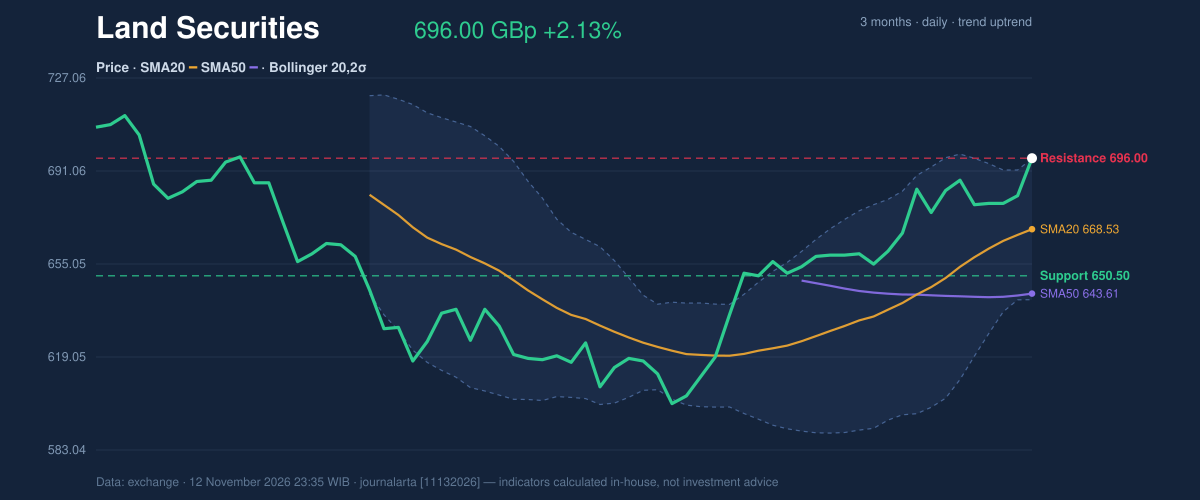
The price also sits at the very top of its 20-day range. Support is at 650.50 and resistance at 696.00, so the stock closed exactly on that ceiling. Over three months the range runs from a low of 597.00 to a high of 717.50. The current price is about 21.50 pence below that high, which is the nearest area where earlier sellers were active.
Oscillators & Momentum
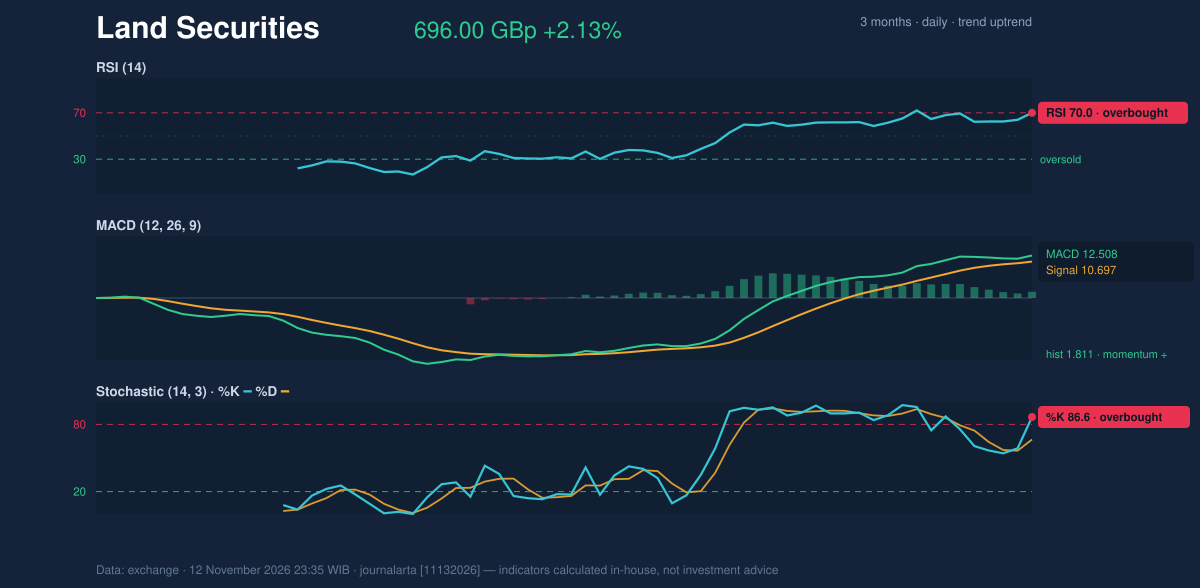
Momentum confirms the trend but also warns of stretch. The 14-day RSI reads 70.0, which is right on the conventional overbought threshold. The Stochastic is further out, with %K at 86.6 against %D at 66.5. Both gauges measure how far a price has run relative to its recent history, and both say the rally has been rapid.
The MACD stands at 12.508 against a signal line of 10.697, leaving a positive histogram of 1.811. In plain terms, short-term momentum is stronger than longer-term momentum and the gap is widening in the bullish direction. Overbought readings in a rising market are not automatically a sell signal. In strong trends they can persist for some time. They do mean that a pause or a shallow pullback would be a normal development rather than proof the trend has broken.
Volatility & Volume
The 14-day Average True Range (ATR) is 13.73 pence, about 2.0% of the price, which DATA describes as moderate volatility. That puts Thursday's 14.50-pence rise (from 681.50 to 696.00) at roughly one typical daily range. It was a firm session but not an extreme one.
Participation backed the move. Volume reached 3,608,739 shares against a 20-day average of 2,934,789, or 1.2 times normal, and OBV is rising. OBV adds volume on up days and subtracts it on down days, so a rising line suggests that buying pressure is behind the price gains. A breakout on above-average volume is generally considered more credible than one on thin trading.
Key Levels & Scenarios
The nearest reference points are clear. If the price holds above the 696.00 resistance, which now coincides with the upper band, the next area on the chart is the three-month high of 717.50. A sustained move beyond it would open the code-computed targets of 730.96 and 765.93. If it fails to hold, the 20-day average at 668.53 is the first cushion, with range support at 650.50 below it. Because RSI and Stochastic are both stretched, a retest of the breakout zone would not be unusual.
Technical Verdict: BUY
JournalArta's research model scores Land Securities at +76 on a scale from −100 to +100, above the +60 threshold for a BUY call. The strongest reasons:
- Trend structure: the price is above the 50-day average, the 20-day average is above the 50-day, and the trend is up.
- Signal balance: two bullish technical signals against none bearish, namely the Bollinger squeeze resolving with a close above the upper band, and rising OBV.
- Momentum: MACD histogram positive at 1.811, with volume at 1.2 times its 20-day average.
Levels computed from the data, valid until 10 December 2026:
- Entry range: 685.72 – 696.00
- Exit target: target 1 at 730.96 and target 2 at 765.93
- Stop loss: 672.69
- Reward/risk: 1.5 to target 1, 3.0 to target 2
The verdict is invalidated if the price falls below 672.69. Overbought readings on RSI (70.0) and Stochastic (86.6) are the main risk to the call, since they leave room for a pullback before the trend resumes.
In plain terms, the chart for Land Securities currently leans clearly upward, but after a sharp run the shares could pause or dip before moving higher.
Summary Data Land Securities
| Last price | 696.00 GBp |
| Change 1 day / 5 days / 1 month | 2.13% / 1.24% / 6.83% |
| Trend / MA-cross | uptrend / none |
| SMA20 / SMA50 | 668.53 / 643.61 |
| RSI (14) / Stochastic %K | 70.0 / 86.6 |
| Bollinger %B / ATR | 100% / 13.73 |
| Support / Resistance 20 days | 650.50 / 696.00 |
| Data as of | 12 November 2026 23:35 WIB |
| JournalArta research verdict (score) | Buy (+76) |
| Entry zone | 685.72 – 696.00 |
| Target 1 / 2 | 730.96 / 765.93 |
| Stop loss | 672.69 |
| Reward/risk | 1.5 / 3.0 |
Today's full Buy and Sell list for UK, Singapore & Hong Kong stocks →
Disclaimer: This technical analysis is generated automatically from exchange data and indicators calculated by JournalArta, for information and education only. The verdict and the entry, target and stop-loss levels are not investment advice or a solicitation to buy or sell any security. Investment decisions and their risks rest solely with the reader.
Track Land Securities share price daily: live levels, support/resistance and our full Land Securities analysis history.