Pro Medicus Share Price on Thursday: Slides 2.18%, Up 24% in a Month
Technical analysis of Pro Medicus stock on November 12, 2026: price 202.79 AUD, trend uptrend, RSI 63.0, support 175.73, resistance 208.23.

Why Pro Medicus is in focus today
- One-day move of 0.00%, about 0.0× its average daily range (ATR)
Selected automatically from 9 ASX (Australia) stocks by a technical-signal score with daily weighted randomisation — not a recommendation.
Trend & Price Action
The structure is still an uptrend. The price sits above the 20-day average at 195.35 and well above the 50-day at 176.76. The 20-day average rose 5.38% over five days, and no new moving-average crossover has formed. In plain terms, the shorter-term trend line is pulling away from the longer one, which is what a healthy advance looks like. The five-day change of -2.61% matters because it cuts against that picture. Over the past week the stock has given back ground while the averages kept climbing. The averages are lagging indicators, so they can keep rising for several sessions after buyers begin to step back.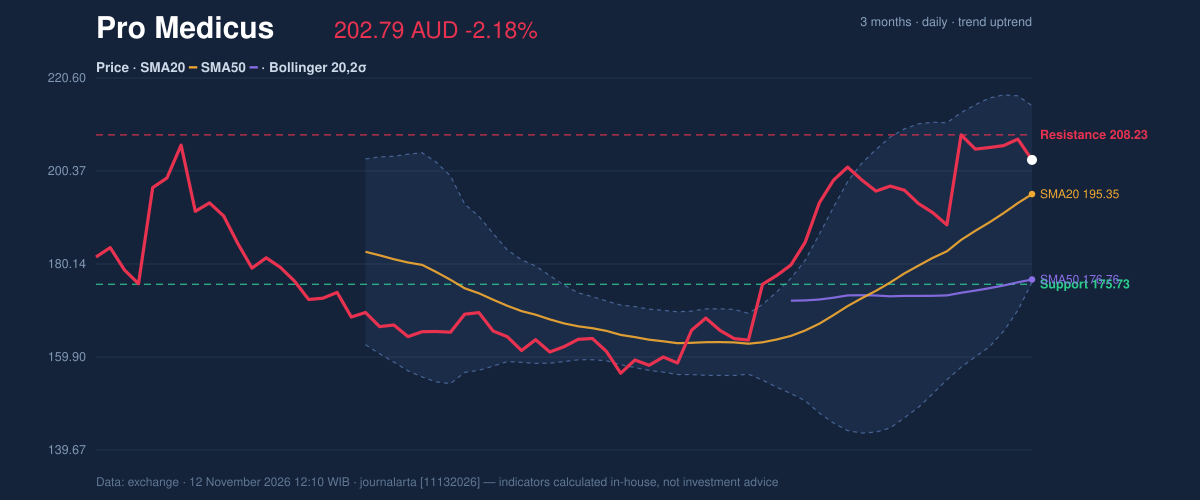
Oscillators & Momentum
Momentum is positive but no longer accelerating. The RSI(14) reads 63.0, in neutral territory. The relative strength index measures how strong recent gains are against recent losses. A reading in the 50–70 zone says buyers still have the upper hand without the stock being stretched. The MACD line is at 8.430 against a signal line of 8.014, a histogram of 0.416. MACD tracks the gap between a fast and a slow average, and a positive histogram means upward momentum is still intact. The margin is thin, though, and a histogram this small can flip within a couple of sessions. The Stochastic oscillator is the more cautious voice. Its %K line stands at 63.6, below the %D line at 80.1. When the fast line slips under the slow one after a high reading, it usually means short-term momentum is fading even though the trend has not broken. The code-computed signals reflect this split: one bullish signal, a pullback to the 20-day average within an uptrend, and one bearish signal, the RSI rolling over from above 65.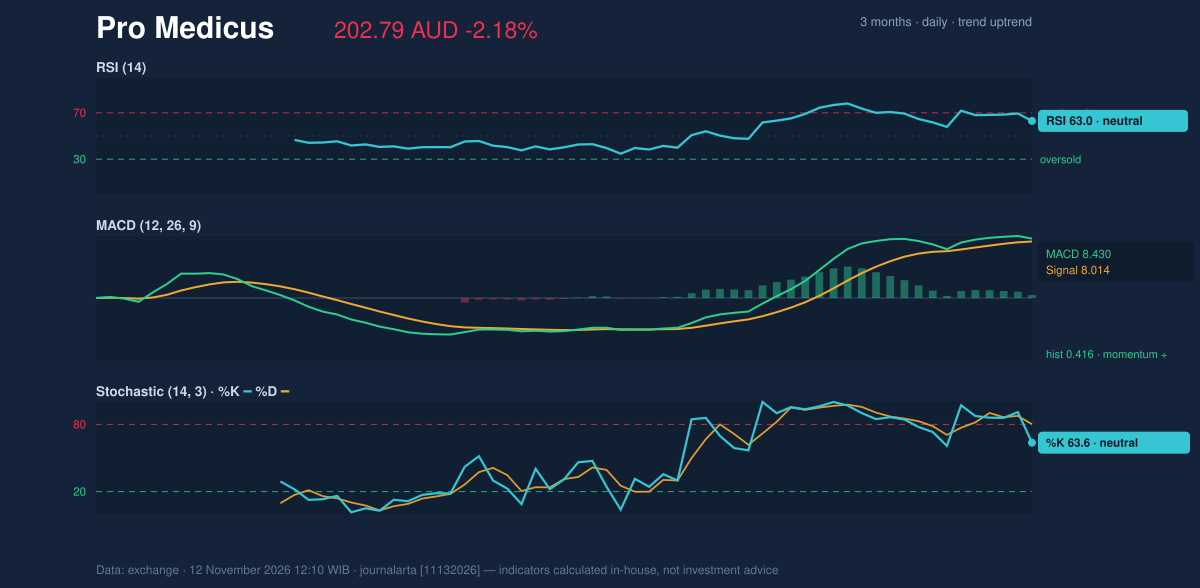
Volatility & Volume
The Bollinger Bands put the price at a %B of 69%, meaning it sits in the upper half of the band. The bands span 176.13 to 214.57 with the midline at 195.35, and their width of 19.7% is classed as normal. There is no squeeze that would hint at an imminent breakout, and no extreme expansion either. The ATR(14) is 7.90, or 3.9% of the price, which is high volatility. For a stock priced above 200 AUD, that implies daily swings of several dollars are routine. Anyone reading Thursday's decline should keep that in mind: the drop is within the stock's normal range. Participation is where the case for caution is strongest. Volume was 202,167 shares, 0.9 times the 20-day average of 236,465, so the decline came on slightly lighter trading than usual. That is mildly reassuring, since heavy selling would be more worrying. But on-balance volume, which tallies volume on up days against down days, is falling. A rising price backed by falling OBV suggests the rally has relied on fewer buyers than its size implies.Key Levels & Scenarios
The code-computed reference levels frame the outcomes. Resistance sits at 208.23, with the three-month high at 212.28. On the downside, support is at 175.73, and the three-month low is 154.15. A move of 1.5 times the ATR gives 190.94 below the price and 214.64 above it. If the price closes above 208.23, the next reference points are 212.28 and 214.64, which sits close to the upper Bollinger Band at 214.57. If it falls toward the 20-day average at 195.35, that area would test whether the pullback is merely routine. A break below 175.73 would put the 154.15 low in view and would damage the uptrend structure.Technical Verdict: HOLD (wait & see)
The JournalArta research score is +50 on a scale running from -100 to +100. A buy call requires +60 or more and a sell call -60 or less, so the stock falls short of either. The verdict is HOLD (wait & see), for three reasons: - Trend is strong: price is above both averages and the 20-day average is above the 50-day. - Momentum is mixed: RSI at 63.0 and a positive MACD histogram support the trend, while the Stochastic %K under %D and a falling OBV show fading participation. - Price sits near resistance: at 83% of the range, with 208.23 close overhead. Conditional scenarios, drawn only from the reference levels: - Upside scenario: entry on a close above 208.23; target 212.28, then 214.64; stop loss at 195.35. - Downside scenario: entry on a break below 175.73; target 154.15; stop loss at 190.94. The verdict is invalidated if the price closes above 208.23 or breaks below 175.73. In plain terms: the trend is up, but momentum and volume have not confirmed it yet, so the data favours waiting for a clear move beyond 208.23 or 175.73 before reading the next direction.Summary Data Pro Medicus
| Last price | 202.79 AUD |
| Change 1 day / 5 days / 1 month | -2.18% / -2.61% / 23.97% |
| Trend / MA-cross | uptrend / none |
| SMA20 / SMA50 | 195.35 / 176.76 |
| RSI (14) / Stochastic %K | 63.0 / 63.6 |
| Bollinger %B / ATR | 69% / 7.90 |
| Support / Resistance 20 days | 175.73 / 208.23 |
| Data as of | 12 November 2026 12:10 WIB |
| JournalArta research verdict (score) | Hold (+50) |
Today's full Buy and Sell list for US stocks →
Disclaimer: This technical analysis is generated automatically from exchange data and indicators calculated by JournalArta, for information and education only. The verdict and the entry, target and stop-loss levels are not investment advice or a solicitation to buy or sell any security. Investment decisions and their risks rest solely with the reader.
Track Pro Medicus share price daily: live levels, support/resistance and our full Pro Medicus analysis history.