QBE Insurance Share Price Update: Rises 1.13%, Near a 3-Month High
Technical analysis of QBE stock on November 12, 2026: price 26.87 AUD, trend uptrend, RSI 65.2, support 25.40, resistance 26.87.

QBE Insurance Group closed at 26.87 AUD on the ASX on Thursday, November 12, 2026, up 1.13% on the day from a previous close of 26.57, according to exchange data. Three of the code-computed technical signals line up bullish and none bearish. The squeeze in the Bollinger Bands has resolved upward, the uptrend is confirmed by rising on-balance volume, and the price has pulled back to its 20-day average within a longer rise. That combination puts the insurer on the watch list.
Why QBE is in focus today
Selected automatically from 9 ASX (Australia) stocks by a technical-signal score with daily weighted randomisation — not a recommendation.
Trend and Price Action
The stock is up 3.79% over five days and 3.83% over one month. The structure behind those gains is orderly. The price sits above the 20-day simple moving average (SMA20) at 26.12, which in turn sits above the 50-day average (SMA50) at 24.53. That stacking, short average over long average and price over both, is the textbook signature of an uptrend.
The 20-day average itself rose 1.14% over five days. That is the slope of the average, not the stock's own gain, and it shows the trend is still being fed by recent prices. No new moving-average cross has formed, so the trend is a continuation rather than a fresh reversal.
The three-month range is 21.50 to 26.91. At 26.87, QBE trades roughly at the top of that band, only marginally below the high.
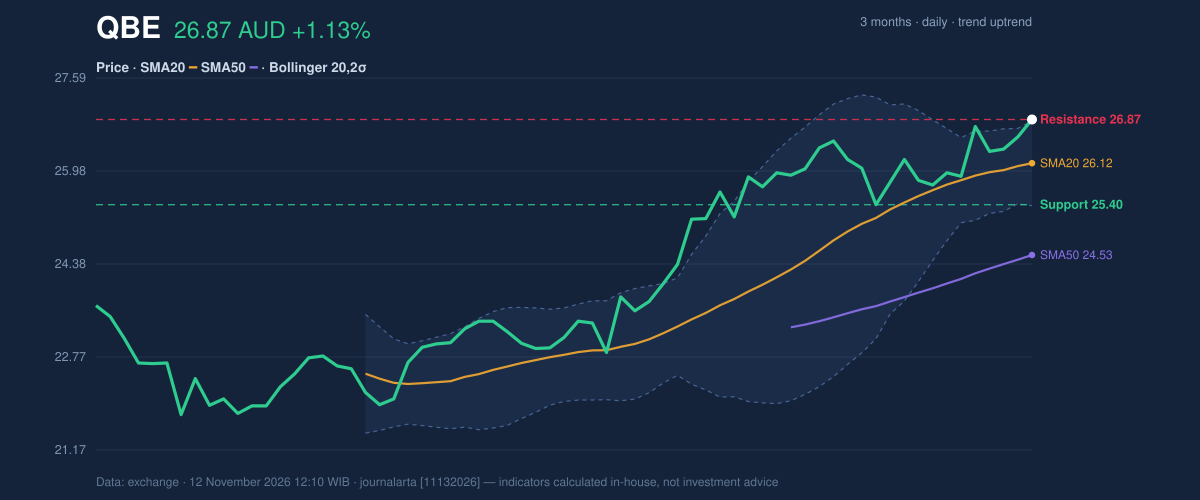
As shown in the chart, the price has climbed through the 20-day average and now pushes against the upper Bollinger Band. The 20-day support sits at 25.40 and the 20-day resistance at 26.87, exactly where the stock closed. In effect, the stock is testing the ceiling of its recent range.
Oscillators and Momentum
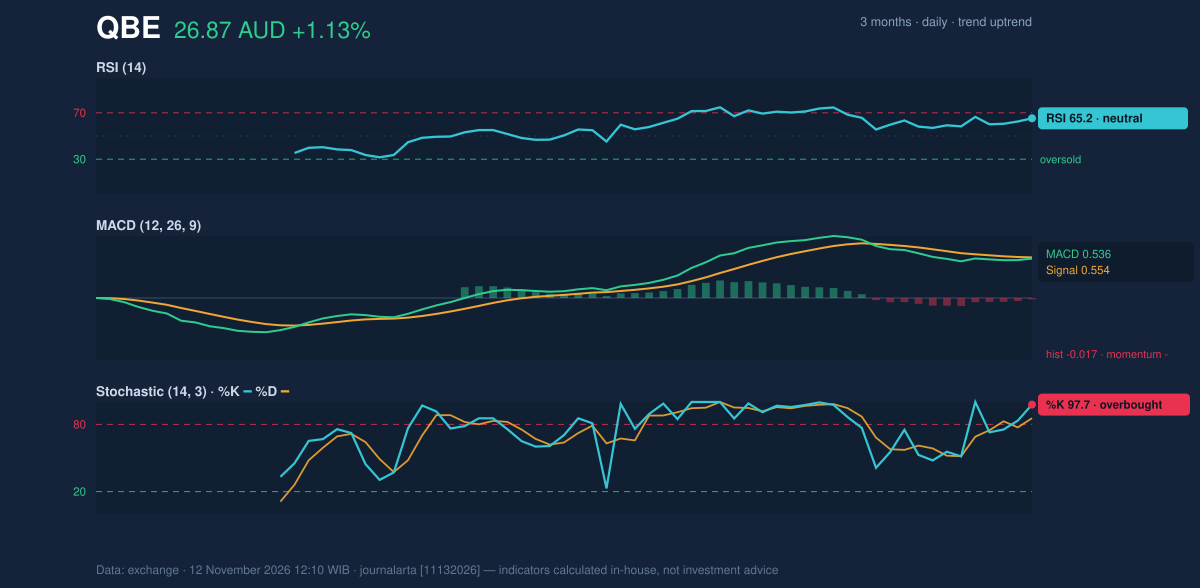
Here the picture is more mixed. The 14-day Relative Strength Index (RSI) reads 65.2, classed as neutral. It is elevated but short of the zone where buying pressure is usually considered stretched. The Stochastic oscillator is hotter, with %K at 97.7 and %D at 85.5, both in overbought territory. Stochastic measures where the close sits within its recent range, so a reading near 100 simply confirms the stock closed at the top of that range.
The MACD, a gauge of whether short-term momentum is gaining or losing on longer-term momentum, shows a line at 0.536 against a signal line at 0.554. The histogram is -0.017, a marginally negative reading. That means the pace of the advance has cooled slightly even as price made new highs. It is a small gap, but it is the main caution flag in the data.
Volatility and Volume
Bollinger Bands (20 days, two standard deviations) run from 25.38 to 26.85, with the midline at 26.12. The close of 26.87 is just above the upper band, giving a %B reading of 101%. The bands had narrowed to a width of 5.6%, a squeeze that often precedes a larger move. A close above the upper band after such a squeeze is what the code flags as a resolved squeeze, a break to the upside.
The average true range (ATR) of 0.56 is 2.1% of the price, a moderate level of daily swing. It gives a sense of scale: a normal day moves the stock about half an Australian dollar.
Participation is the weaker link. Volume was 2,582,079 shares, 0.8 times the 20-day average of 3,397,764. A breakout on below-average volume is less convincing than one on heavy turnover. On the other hand, on-balance volume (OBV), which adds volume on up days and subtracts it on down days, is rising. That suggests buyers have been dominating across the broader window, even if Thursday's session was quiet.
Key Levels and Scenarios
The immediate test is whether the stock can hold above the 26.85 upper band and the 26.87 resistance. If it holds, the code-derived upside objectives are 28.29 and 29.72. If it slips back inside the bands, the 20-day average at 26.12 becomes the first area where buyers have recently stepped in, with the 25.40 support below that.
Technical Verdict: BUY
JournalArta's research model scores QBE at +84 on a scale of -100 to +100, above the +60 threshold for a BUY call. The strongest reasons:
- Trend structure: price above the 50-day average, the 20-day average above the 50-day, and an established uptrend.
- Bollinger squeeze resolved upward: a close above the upper band after a narrowing of the bands.
- OBV rising: volume flow confirms the advance, despite Thursday's 0.8× volume.
The call carries risks the data makes visible: Stochastic %K at 97.7 is overbought, and the MACD histogram at -0.017 shows momentum easing. The verdict is invalidated if the price falls below 25.92.
- Entry range: 26.46 – 26.87
- Exit target 1: 28.29 (reward/risk 1.5)
- Exit target 2: 29.72 (reward/risk 3.0)
- Stop loss: 25.92
- Valid until: 10 Dec 2026
In plain terms, the chart favors the upside for QBE for now, but the stock has run hard and fast, so the setup only holds while the price stays above 25.92.
This is technical analysis based on market data, not an investment recommendation.
Summary Data QBE
| Last price | 26.87 AUD |
| Change 1 day / 5 days / 1 month | 1.13% / 3.79% / 3.83% |
| Trend / MA-cross | uptrend / none |
| SMA20 / SMA50 | 26.12 / 24.53 |
| RSI (14) / Stochastic %K | 65.2 / 97.7 |
| Bollinger %B / ATR | 101% / 0.56 |
| Support / Resistance 20 days | 25.40 / 26.87 |
| Data as of | 12 November 2026 12:10 WIB |
| JournalArta research verdict (score) | Buy (+84) |
| Entry zone | 26.46 – 26.87 |
| Target 1 / 2 | 28.29 / 29.72 |
| Stop loss | 25.92 |
| Reward/risk | 1.5 / 3.0 |
Today's full Buy and Sell list for US stocks →
Disclaimer: This technical analysis is generated automatically from exchange data and indicators calculated by JournalArta, for information and education only. The verdict and the entry, target and stop-loss levels are not investment advice or a solicitation to buy or sell any security. Investment decisions and their risks rest solely with the reader.
Track QBE share price daily: live levels, support/resistance and our full QBE analysis history.