Xero Share Price Jumps 6.08% (November 12, 2026): Up 30.2% in a Month
Technical analysis of Xero stock on November 12, 2026: price 75.17 AUD, trend uptrend, RSI 72.5, support 60.32, resistance 75.17.

Xero's shares jumped 6.08% on the Australian Securities Exchange on Thursday, November 12, 2026, to a last price of 75.17 AUD from a previous close of 70.86. The move came on volume of 2,208,775 shares, about 2.1 times the 20-day average of 1,027,508. A rise of that size on double the usual turnover suggests real participation rather than a thin-market drift. The stock is now up 30.23% over one month, and the daily and five-day gains are the same 6.08%, so nearly all of this week's advance arrived in a single session.
Why Xero is in focus today
- One-day move of 0.00%, about 0.0× its average daily range (ATR)
- Volume at 0.0× the 20-day average
Selected automatically from 9 ASX (Australia) stocks by a technical-signal score with daily weighted randomisation — not a recommendation.
Trend and Price Action
The structure is firmly bullish. The price sits well above the 20-day moving average (SMA20) at 65.51 and the 50-day average (SMA50) at 63.66. The 20-day average itself rose 4.69% over five days, which shows the advance has been building for some time. A golden cross formed two sessions before the latest one, meaning the faster average crossed above the slower one. Traders read that as a shift in medium-term momentum, but it is not a fresh signal from today alone.
The stock is also testing the top of its recent range. The 20-day resistance is 75.17, exactly the last price, so the shares sit at 100% of the 20-day range. Support is at 60.32. Context matters, though. The 3-month high is 89.54 and the low is 55.09, so the stock is still well below its peak. The rally looks more like a recovery within a wider range than a breakout into untested territory.
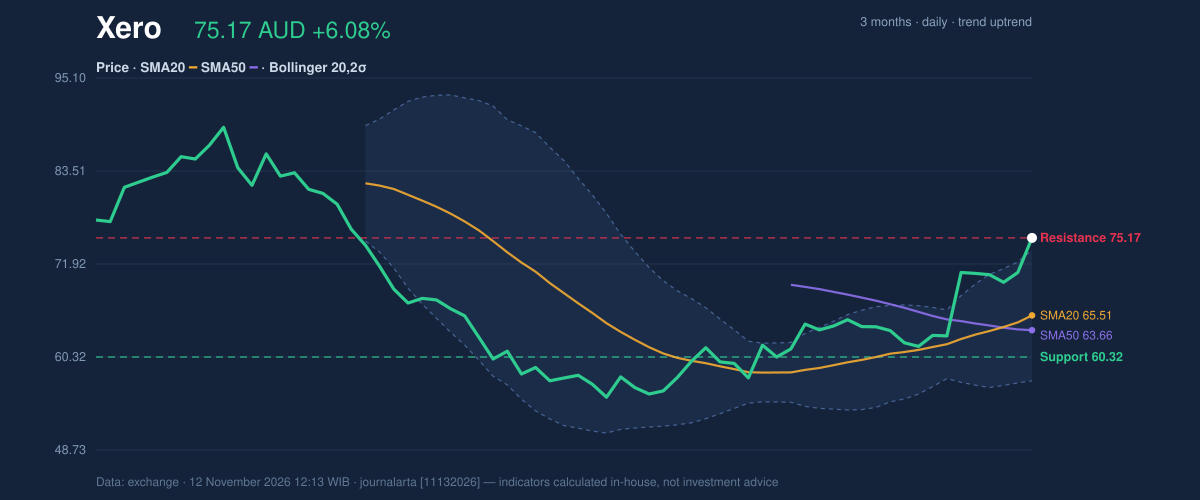
As shown in the chart, the price has pushed through the upper Bollinger Band. The upper band is at 73.66, the middle at 65.51 and the lower at 57.36. The reading of %B at 109% means the price is above the upper band. That often marks strength, but it also means the stock has moved far from its average in a short time. Band width has expanded to 24.9%, a sign that volatility is rising rather than compressing.
Oscillators and Momentum
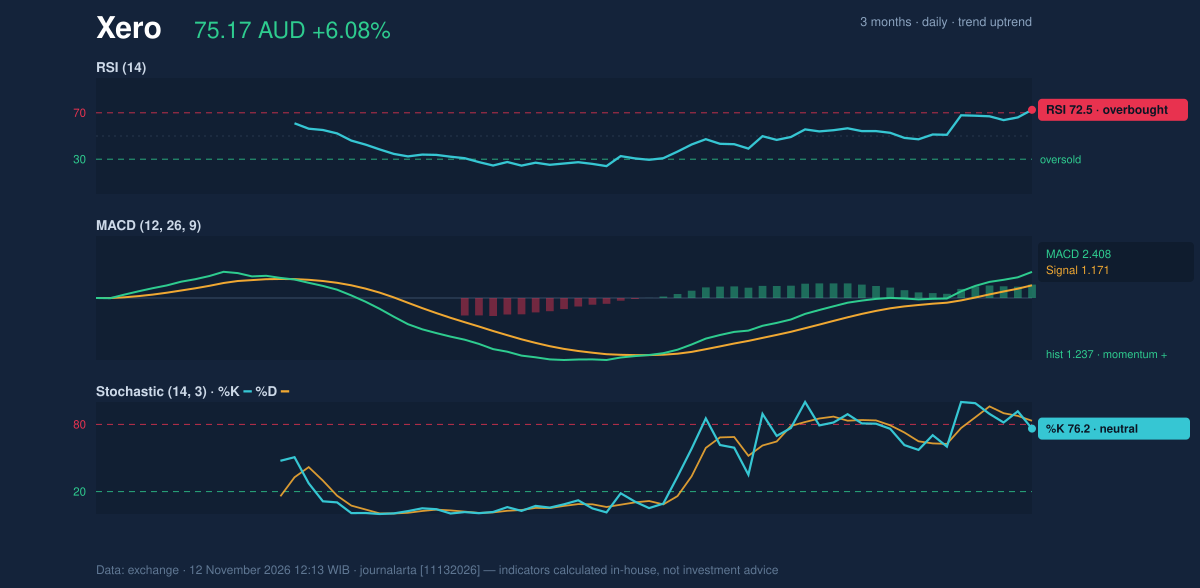
Momentum confirms the trend but also warns of stretch. The 14-day RSI is 72.5, in overbought territory. That does not mean a reversal is due, because strong trends can stay overbought for long periods. It does mean the price has risen faster than its recent pattern, and the move is more exposed to a pause. The Stochastic reading is neutral, with %K at 76.2 and %D at 83.2. %K sitting below %D hints that short-term momentum is cooling slightly even as the price hits new 20-day highs.
The MACD is more supportive. The line is at 2.408 against a signal line of 1.171, leaving a histogram of 1.237. A positive and widening gap between the two means upward momentum is still intact.
Volatility and Volume
The average true range (ATR) is 3.51 AUD, or 4.7% of the price. In plain terms, the stock has been moving about 3.5 dollars on a typical day, so a swing of several dollars in either direction would not be unusual. This is why levels matter more than headlines for this stock.
Volume offers a mixed message. The 2.1 times volume spike supports the breakout above the 20-day high. However, on-balance volume (OBV), which tracks whether volume is flowing in on up days or out on down days, is falling. That is a divergence. The price is rising while cumulative volume flow has not confirmed it. It is the main caution against an otherwise strong picture, and a reason the rally needs follow-through in the coming sessions.
Key Levels and Scenarios
If the price holds above the 73.66 upper band and clears 75.17 on continued volume, the way opens toward the levels below. If it slips back inside the bands and loses the SMA20 at 65.51, the move would look like an overextended spike. The nearest support is 60.32, with the SMA50 at 63.66 above it.
Technical Verdict: BUY
JournalArta's research model scores the stock at +71 on a scale of −100 to +100, above the +60 threshold for a BUY call. The strongest reasons are:
- Trend alignment: the price is above both averages, the SMA20 is above the SMA50, and the golden cross is recent.
- Breakout on volume: the close is above the 20-day high on volume 2.1 times average, with two bullish signals and none bearish.
- Momentum: the MACD histogram of 1.237 is positive. The overbought RSI of 72.5 and the falling OBV are the risks to watch.
The verdict is invalidated if the price falls below the stop loss of 69.21.
- Entry range: 72.55 – 75.17 AUD
- Exit target 1: 84.11 AUD (reward/risk 1.5)
- Exit target 2: 93.05 AUD (reward/risk 3.0)
- Stop loss: 69.21 AUD
For non-traders: the chart currently favors the upside, but the stock has already run hard, so it could pause or pull back before going further. This is a technical analysis, not an investment recommendation. The levels above are valid until 10 December 2026.
Summary Data Xero
| Last price | 75.17 AUD |
| Change 1 day / 5 days / 1 month | 6.08% / 6.08% / 30.23% |
| Trend / MA-cross | uptrend / golden |
| SMA20 / SMA50 | 65.51 / 63.66 |
| RSI (14) / Stochastic %K | 72.5 / 76.2 |
| Bollinger %B / ATR | 109% / 3.51 |
| Support / Resistance 20 days | 60.32 / 75.17 |
| Data as of | 12 November 2026 12:13 WIB |
| JournalArta research verdict (score) | Buy (+71) |
| Entry zone | 72.55 – 75.17 |
| Target 1 / 2 | 84.11 / 93.05 |
| Stop loss | 69.21 |
| Reward/risk | 1.5 / 3.0 |
Today's full Buy and Sell list for US stocks →
Disclaimer: This technical analysis is generated automatically from exchange data and indicators calculated by JournalArta, for information and education only. The verdict and the entry, target and stop-loss levels are not investment advice or a solicitation to buy or sell any security. Investment decisions and their risks rest solely with the reader.
Track Xero share price daily: live levels, support/resistance and our full Xero analysis history.