CommBank Share Price Update: Climbs 2.89%, Up 3.3% in Five Sessions
Technical analysis of CommBank stock on November 12, 2026: price 171.76 AUD, trend uptrend, RSI 67.9, support 154.38, resistance 171.76.

Commonwealth Bank of Australia closed at A$171.76 on Thursday, November 12, 2026, up 2.89% on the day. The close was exactly the top of its 20-day range, so the stock finished the session at resistance. It has risen 3.29% over five days and 10.00% over one month. Those moves are why CommBank deserves a close look on the technical screen.
Why CommBank is in focus today
- One-day move of 0.00%, about 0.0× its average daily range (ATR)
Selected automatically from 9 ASX (Australia) stocks by a technical-signal score with daily weighted randomisation — not a recommendation.
Trend & Price Action
The trend is up, and the structure behind it is orderly. CBA trades above its 20-day average of 163.54 and its 50-day average of 157.10. The shorter average sits above the longer one, which is how an established uptrend looks. There is no fresh moving-average crossover. The alignment is a continuation of the trend, not a new signal.
The 20-day average rose 2.48% over five days. That slope describes the average, not the share price, and it shows that recent buyers have been paying progressively higher prices. The gap between the last price and the 20-day average gives a sense of how stretched the move is. The 50-day average is further back, so the stock has pulled away from both reference lines.
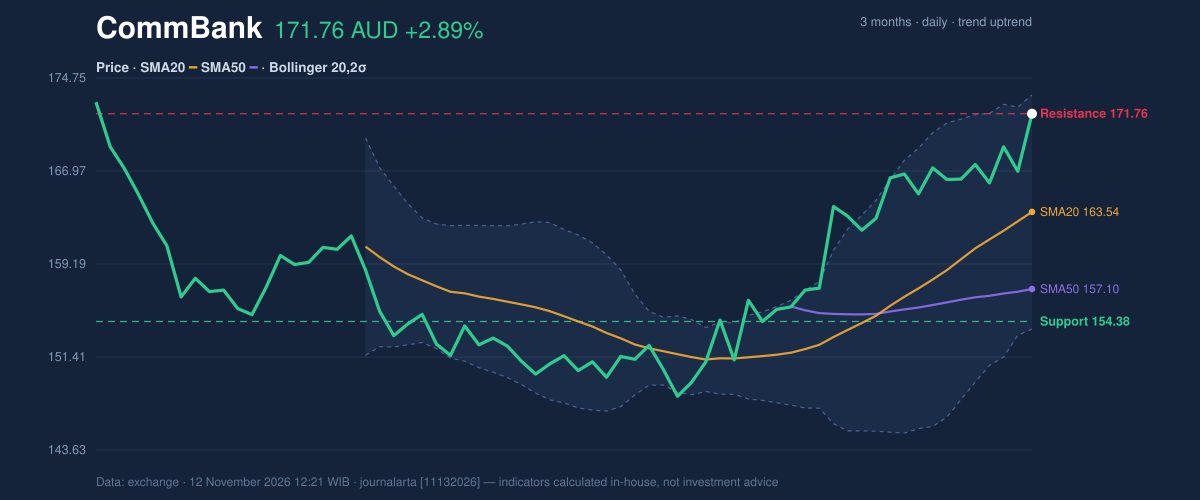
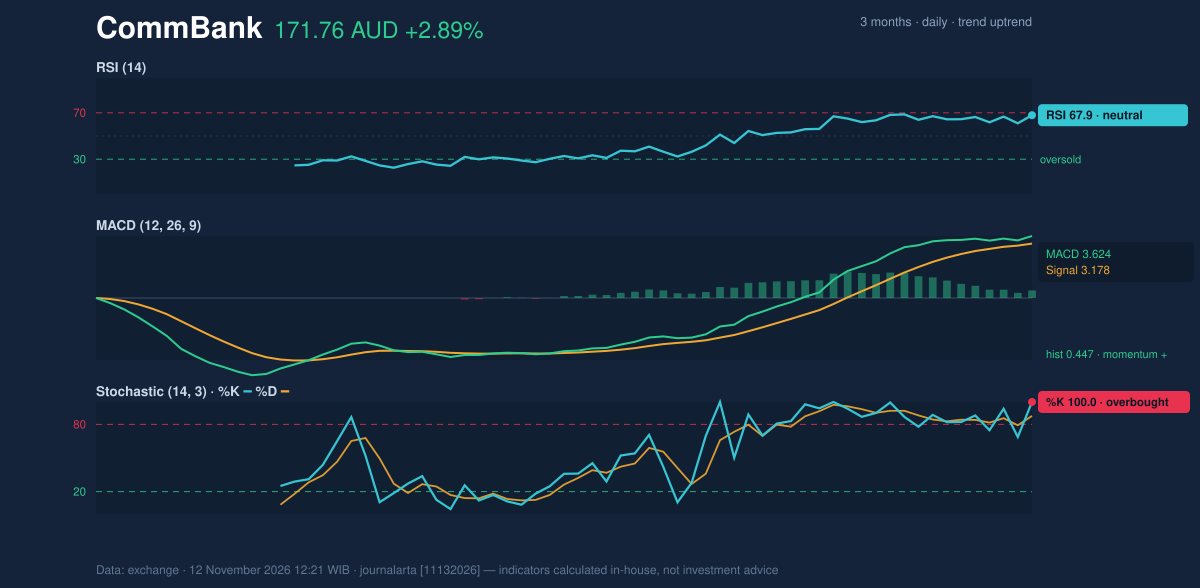
As the chart shows, the close at 171.76 sits at the 20-day resistance level and at 100% of the 20-day range. Support over the same window is 154.38. The wider three-month range runs from a low of 147.41 to a high of 176.45, so the stock is trading in the upper part of its recent history and still has room before it tests that peak.
Oscillators & Momentum
Momentum confirms the trend, with one caution. The 14-day RSI is 67.9, classed as neutral. It is firm but below the conventional 70 line that marks overbought territory. In plain terms, buyers are in control but the move has not yet reached the level where RSI usually flags exhaustion.
The Stochastic oscillator is less restrained. Its %K reads 100.0 against a %D of 87.5, which is overbought. The Stochastic compares the close with the recent trading range, so a reading of 100 simply says the stock closed at the top of that range. In strong uptrends it can stay pinned there for days. It is still a reminder that a short pause or pullback would not be unusual.
MACD points the same way as the trend. The line stands at 3.624 against a signal line of 3.178, leaving a histogram of 0.447, which indicates positive momentum. Both lines are above zero and the line is above its signal, so the trend and the momentum readings agree.
Volatility & Volume
The Bollinger Bands (20 days, two standard deviations) put the upper band at 173.33, the middle at 163.54 and the lower at 153.76. The close sits at a %B of 92%, near the top of the channel. Band width is 12.0%, described as normal, so this is a steady advance, not a squeeze followed by a burst. The upper band is only 1.57 above the last price, which makes it the next ceiling to watch alongside the 20-day resistance.
The 14-day ATR, a measure of the average daily swing, is 3.83, or 2.2% of the price. That is moderate volatility. A move to the upper band is about 0.4 of a typical day's range. This tells readers that the stock does not need an unusual move to touch the next barrier.
Volume offers a measured vote of confidence. The last session traded 2,294,282 shares against a 20-day average of 2,213,990, or 1.0× normal. A rally on average volume is neither a warning nor a strong endorsement. On-balance volume, which adds volume on up days and subtracts it on down days, is rising, so volume has been backing the gains. The code's own tally counts one bullish signal, an uptrend confirmed by rising OBV, and no bearish ones.
Key Levels & Scenarios
The nearest test is the 20-day resistance at 171.76, which coincides with the last close, followed by the Bollinger upper band at 173.33 and the three-month high at 176.45. A sustained close beyond the resistance zone would suggest the advance is extending. If the stock fails to hold, the first reference is the SMA20 near 163.54, with the 20-day support at 154.38 further down.
Technical Verdict: BUY
JournalArta's research model scores CBA at +68 on a −100 to +100 scale, above the +60 threshold for a BUY call. The strongest reasons are:
- Trend structure: price is above the 50-day average and the 20-day average is above the 50-day, in an uptrend.
- Momentum: RSI at 67.9 sits in the constructive 50–70 zone, and MACD histogram is positive at 0.447.
- Participation: on-balance volume is rising alongside price.
The caution is the Stochastic reading of 100.0, which leaves the stock vulnerable to a pause near resistance.
Levels computed from the data, valid until 10 December 2026:
- Entry range: 168.89 – 171.76
- Exit targets: target 1 at 181.54, target 2 at 191.32
- Stop loss: 165.24
- Reward/risk: 1.5 to target 1, 3.0 to target 2
The verdict is invalidated if the price falls below 165.24.
In plain English: the chart shows CommBank's share price rising steadily with solid support behind it, but after a strong month it may pause before going higher.
Summary Data CommBank
| Last price | 171.76 AUD |
| Change 1 day / 5 days / 1 month | 2.89% / 3.29% / 10.00% |
| Trend / MA-cross | uptrend / none |
| SMA20 / SMA50 | 163.54 / 157.10 |
| RSI (14) / Stochastic %K | 67.9 / 100.0 |
| Bollinger %B / ATR | 92% / 3.83 |
| Support / Resistance 20 days | 154.38 / 171.76 |
| Data as of | 12 November 2026 12:21 WIB |
| JournalArta research verdict (score) | Buy (+68) |
| Entry zone | 168.89 – 171.76 |
| Target 1 / 2 | 181.54 / 191.32 |
| Stop loss | 165.24 |
| Reward/risk | 1.5 / 3.0 |
Today's full Buy and Sell list for US stocks →
Disclaimer: This technical analysis is generated automatically from exchange data and indicators calculated by JournalArta, for information and education only. The verdict and the entry, target and stop-loss levels are not investment advice or a solicitation to buy or sell any security. Investment decisions and their risks rest solely with the reader.
Track CommBank share price daily: live levels, support/resistance and our full CommBank analysis history.