Computershare Share Price Rises 0.64% on Thursday, Near a 3-Month High
Technical analysis of Computershare stock on November 12, 2026: price 43.81 AUD, trend uptrend, RSI 67.3, support 41.94, resistance 43.81.

Computershare (ASX: CPU) closed Thursday's session on 43.81 AUD, up 0.64% on the day and sitting exactly at the top of its 20-day range. The share price has added 3.25% over five days and 5.80% over one month. The setup is what makes it worth watching: a narrowing Bollinger squeeze appears to have resolved upward, with the close landing at 101% of the band's width, just above the upper line.
Why Computershare is in focus today
Selected automatically from 9 ASX (Australia) stocks by a technical-signal score with daily weighted randomisation — not a recommendation.
The stock rose by a modest amount. The structure behind it is the more telling part.
Trend & Price Action
The stock is in a confirmed uptrend. The last price of 43.81 sits above the 20-day simple moving average (SMA20) at 42.77 and well above the 50-day average (SMA50) at 41.28. Both averages are stacked in bullish order, with the shorter one on top, which generally signals that recent buyers have been paying more than earlier ones. No fresh crossover has formed, so this is a mature trend rather than a newly flipped one. The 20-day average itself rose 1.59% over five days, showing the climb is steady rather than a single-day spike.
As the chart shows, price has pushed to the upper edge of its recent channel. The 3-month range runs from a low of 38.43 to a high of 44.13, so the stock is trading only about 0.7% below its three-month peak.
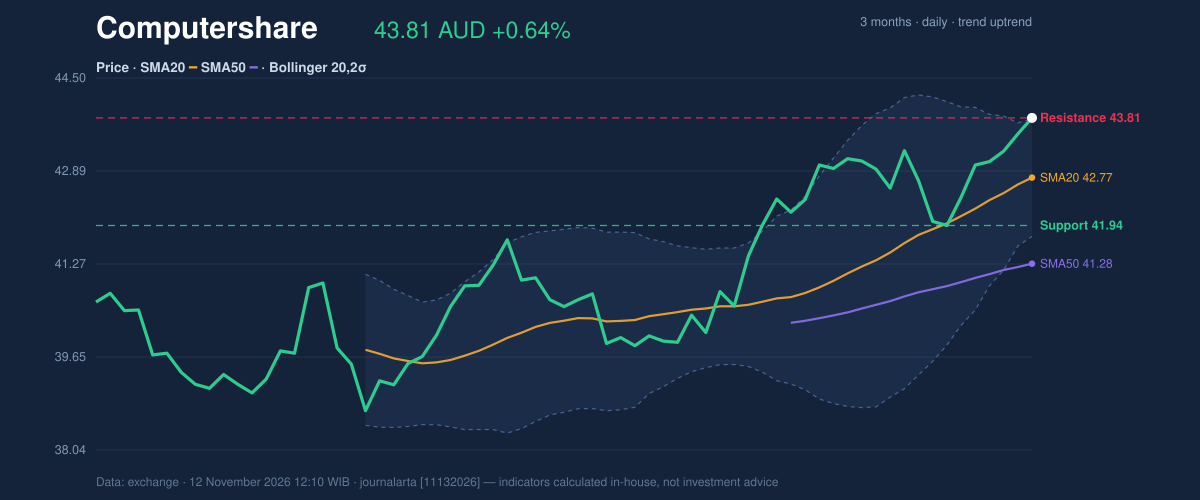
The 20-day range is bounded by support at 41.94 and resistance at 43.81. The close matched that resistance exactly, meaning the stock has reached the ceiling of its recent range and is testing whether it can hold there.
Oscillators & Momentum
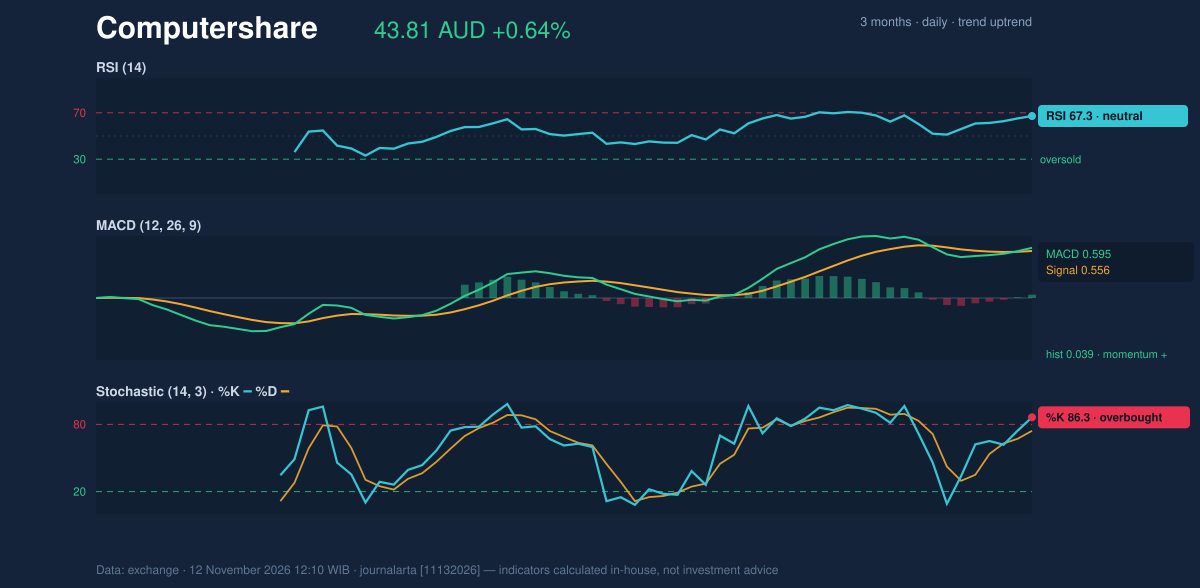
Momentum supports the trend without being stretched everywhere. The 14-day Relative Strength Index (RSI), which measures the speed of recent gains on a 0–100 scale, reads 67.3. That is firm but still classed as neutral, below the 70 mark that is often read as overheated. In plain terms, buyers are in control, yet the stock has not run out of room by this gauge.
The Stochastic oscillator is more cautious. Its %K line reads 86.3 against a %D of 74.2, which places it in overbought territory. This indicator compares the close with the recent high-low range, so a high reading simply confirms the stock is finishing near the top of that range. Overbought readings in an uptrend often persist, but they do raise the odds of a short pause or pullback.
The Moving Average Convergence Divergence (MACD) line stands at 0.595 versus a signal line of 0.556, leaving a histogram of 0.039. That positive histogram marks the point where momentum has just turned in the buyers' favour. The margin is thin, so it is an early confirmation rather than a strong surge.
Volatility & Volume
The Bollinger Bands, which draw a channel two standard deviations around the 20-day average, are narrow: the band width is only 4.8%. Such a squeeze often precedes a bigger move, and here the resolution came upward. The close of 43.81 sits just above the upper band at 43.80, with the middle band at 42.77 and the lower at 41.75. A close outside the upper band does not guarantee follow-through, but it shows buyers were willing to pay a premium to break out of the compression.
The Average True Range (ATR) is 0.83, or 1.9% of the price, which describes moderate daily swings. That gives a practical yardstick: moves of under one Australian dollar in a session would be ordinary for this stock.
Participation backs the breakout. Volume was 1,658,049 shares, about 1.1 times the 20-day average of 1,500,894. It is not a dramatic surge, but it is above normal. On-balance volume (OBV), which adds volume on up days and subtracts it on down days, is rising, indicating money is flowing in rather than out.
Key Levels & Scenarios
The immediate test is whether the stock can hold above the old ceiling at 43.81 and the upper band at 43.80. If it does, the next reference points in the code-derived levels are 46.87 and 49.93. If the breakout fails and price slips back inside the band, the SMA20 at 42.77 becomes the first area to watch, followed by 41.94 support. A decisive break below the 41.77 level would undermine the bullish structure.
Technical Verdict: BUY
JournalArta's research model rates the setup BUY, with a score of +92 on a scale running from −100 to +100 (the buy threshold is +60). Four bullish technical signals are active against none bearish. The strongest reasons:
- Trend structure: price is above both the SMA20 (42.77) and SMA50 (41.28), and the 20-day average sits above the 50-day.
- Breakout with momentum: the Bollinger squeeze resolved with a close above the upper band, while the MACD histogram has just turned positive at 0.039.
- Volume confirmation: OBV is rising and volume ran at 1.1 times its 20-day average.
The verdict is invalidated if price breaks and holds below the 41.77 stop-loss level. A caution: the Stochastic at 86.3 is overbought, so a brief pullback toward the entry zone would not be unusual.
- Entry range: 43.20 – 43.81
- Exit target 1: 46.87 (reward/risk 1.5)
- Exit target 2: 49.93 (reward/risk 3.0)
- Stop loss: 41.77
- Valid until: 10 December 2026
In plain terms: the chart currently favours the upside, but the call is a technical reading valid until 10 December, not a promise, and it falls apart if the stock drops below 41.77. This is technical analysis, not investment advice.
The next scheduled checkpoint is the model's review on 10 December 2026, when the verdict levels expire.
Summary Data Computershare
| Last price | 43.81 AUD |
| Change 1 day / 5 days / 1 month | 0.64% / 3.25% / 5.80% |
| Trend / MA-cross | uptrend / none |
| SMA20 / SMA50 | 42.77 / 41.28 |
| RSI (14) / Stochastic %K | 67.3 / 86.3 |
| Bollinger %B / ATR | 101% / 0.83 |
| Support / Resistance 20 days | 41.94 / 43.81 |
| Data as of | 12 November 2026 12:10 WIB |
| JournalArta research verdict (score) | Buy (+92) |
| Entry zone | 43.20 – 43.81 |
| Target 1 / 2 | 46.87 / 49.93 |
| Stop loss | 41.77 |
| Reward/risk | 1.5 / 3.0 |
Today's full Buy and Sell list for US stocks →
Disclaimer: This technical analysis is generated automatically from exchange data and indicators calculated by JournalArta, for information and education only. The verdict and the entry, target and stop-loss levels are not investment advice or a solicitation to buy or sell any security. Investment decisions and their risks rest solely with the reader.
Track Computershare share price daily: live levels, support/resistance and our full Computershare analysis history.