Insurance Australia Share Price on Thursday: Rises 0.67%, Near a 3-Month High
Technical analysis of IAG stock on November 12, 2026: price 9.03 AUD, trend uptrend, RSI 67.0, support 8.57, resistance 9.03.

Insurance Australia Group closed Thursday's ASX session at A$9.03, up 0.67% on the day and sitting right on the 20-day resistance line, with volume running 1.8 times its norm. For international readers tracking Australian financials, the question is whether a quiet insurer's steady climb has the participation to carry through a ceiling it has just touched.
Why IAG is in focus today
- Volume at 0.0× the 20-day average
Selected automatically from 9 ASX (Australia) stocks by a technical-signal score with daily weighted randomisation — not a recommendation.
The stock rose 2.03% over five sessions and 6.49% over the past month, against a previous close of 8.97 on 12 November (exchange local date). Volume reached 9,141,292 shares versus a 20-day average of 5,192,566, a lift that matters because it arrived on a day the price pressed against its recent high.
Trend and Price Action
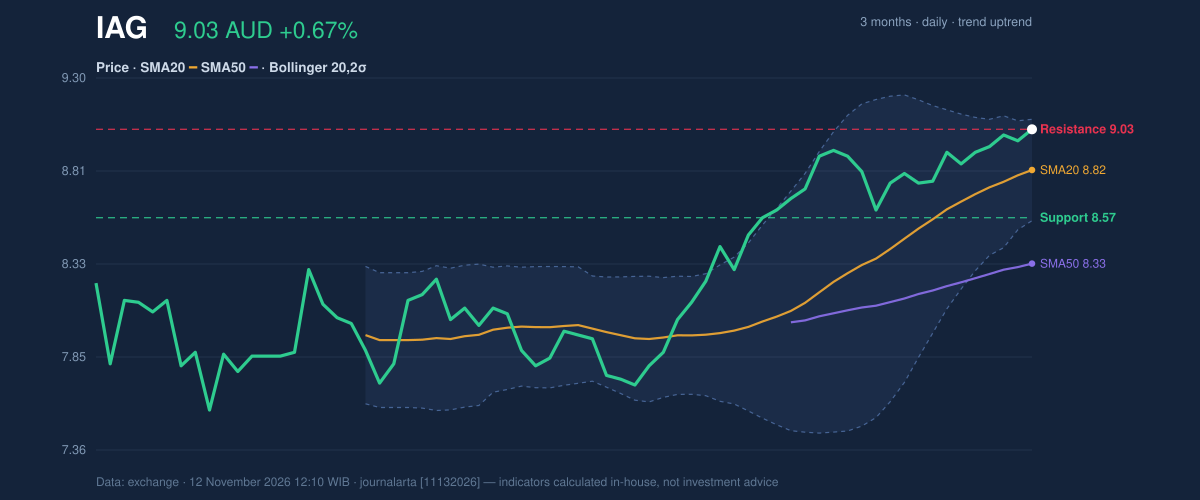
The structure is a clean uptrend. The price sits above both the 20-day average (8.82) and the 50-day average (8.33), and the 20-day average has risen 1.90% over five days. That slope describes the average, not the share price; it shows the recent cost basis of buyers is climbing steadily. No fresh moving-average cross has formed, so the trend is established rather than newly triggered.
The stock now trades at the top of its range. The 20-day support is 8.57 and resistance is 9.03, putting the price at 100% of that band. The three-month high is 9.06 and the low 7.50, so the shares are only 0.03 below their quarterly peak, as shown in the chart.
Oscillators and Momentum
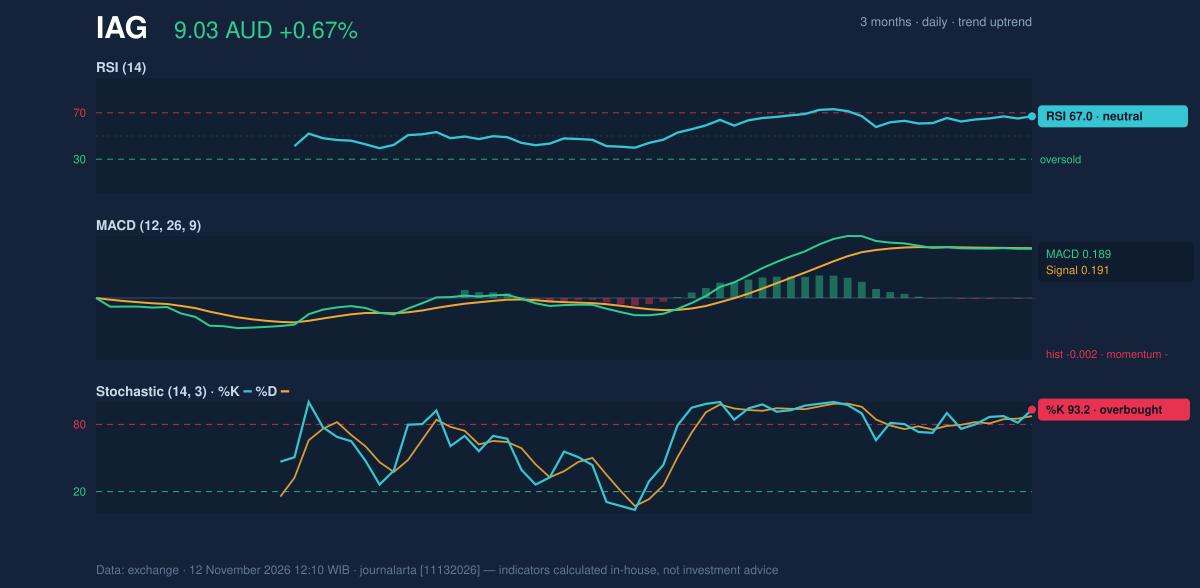
Momentum is strong but stretched. The 14-day RSI is 67.0, still in neutral territory and short of the conventional overbought line, meaning the rally has room before it looks exhausted by that measure. The Stochastic is hotter: %K at 93.2 and %D at 87.4 are both in overbought territory. That reading says the close is near the top of its recent range, which tends to precede pauses rather than reversals when the trend is intact.
The MACD offers the one cautionary note. The line sits at 0.189 against a signal of 0.191, leaving a histogram of -0.002. The gap is tiny, but it indicates the pace of gains has cooled even as price edged higher.
Volatility and Volume
The Bollinger Bands run from 8.55 to 9.08 with the middle at 8.82. Price sits at a %B of 90%, close to the upper band, while band width has narrowed to 6.0%. A narrowing, or squeeze, means volatility has been compressing, and such phases often resolve in a larger move. The data do not say which direction, but the trend and volume lean upward.
The 14-day ATR is 0.19, or 2.1% of the price, a moderate daily range. On-balance volume, which adds volume on up days and subtracts it on down days, is rising, so buying participation is confirming the price. Thursday's 1.8× volume surge came as the close moved above the 20-day high, a combination the screening model counts as a bullish breakout signal.
Key Levels and Scenarios
The immediate test is the 9.03 to 9.06 zone, where the 20-day resistance and three-month high cluster. A sustained close above it would clear the quarter's ceiling. If the price instead slips back, the first cushions are the 20-day average at 8.82 and the lower end of the entry zone near 8.89, with the 20-day support at 8.57 beneath. A fall under 8.70 would damage the setup.
Technical Verdict: BUY
JournalArta's research model rates IAG BUY with a score of +89 on a −100 to +100 scale, where +60 is the threshold. Three bullish signals are active and none bearish. The strongest reasons:
- Breakout on volume: the close is above the 20-day high with volume 1.8× average, above the 1.5× threshold.
- Trend alignment: price is above the 50-day average, the 20-day average sits above the 50-day, and OBV is rising.
- Momentum still supportive: RSI at 67.0 is not yet overbought, although the Stochastic at 93.2 and the flat MACD histogram argue for a pause first.
Levels computed by the model, valid until 10 December 2026:
- Entry range: 8.89 – 9.03
- Exit target 1: 9.52 (reward/risk 1.5)
- Exit target 2: 10.02 (reward/risk 3.0)
- Stop loss: 8.70
The verdict is invalidated if the price falls below 8.70. In plain terms: the data show buyers in control of a rising stock, but with the price near its ceiling and short-term indicators stretched, a brief pullback would not be surprising. This is technical analysis, not an investment recommendation.
| Indicator | Value |
|---|---|
| Last price (12 Nov 2026) | A$9.03 |
| Change 1 day / 5 days / 1 month | 0.67% / 2.03% / 6.49% |
| SMA20 / SMA50 | 8.82 / 8.33 |
| Bollinger upper / middle / lower | 9.08 / 8.82 / 8.55 |
| RSI(14) | 67.0 |
| Stochastic %K / %D | 93.2 / 87.4 |
| MACD / signal / histogram | 0.189 / 0.191 / -0.002 |
| ATR(14) | 0.19 (2.1%) |
| Volume vs 20-day average | 9,141,292 vs 5,192,566 (1.8×) |
| Support / resistance (20-day) | 8.57 / 9.03 |
| 3-month high / low | 9.06 / 7.50 |
The next checkpoint is whether Friday's session can hold above 9.03 and extend toward the 9.06 three-month high.
Summary Data IAG
| Last price | 9.03 AUD |
| Change 1 day / 5 days / 1 month | 0.67% / 2.03% / 6.49% |
| Trend / MA-cross | uptrend / none |
| SMA20 / SMA50 | 8.82 / 8.33 |
| RSI (14) / Stochastic %K | 67.0 / 93.2 |
| Bollinger %B / ATR | 90% / 0.19 |
| Support / Resistance 20 days | 8.57 / 9.03 |
| Data as of | 12 November 2026 12:10 WIB |
| JournalArta research verdict (score) | Buy (+89) |
| Entry zone | 8.89 – 9.03 |
| Target 1 / 2 | 9.52 / 10.02 |
| Stop loss | 8.70 |
| Reward/risk | 1.5 / 3.0 |
Today's full Buy and Sell list for US stocks →
Disclaimer: This technical analysis is generated automatically from exchange data and indicators calculated by JournalArta, for information and education only. The verdict and the entry, target and stop-loss levels are not investment advice or a solicitation to buy or sell any security. Investment decisions and their risks rest solely with the reader.
Track IAG share price daily: live levels, support/resistance and our full IAG analysis history.