Persimmon Share Price on Thursday: Climbs 3.23%, Up 2.3% in a Month
Technical analysis of Persimmon stock on November 12, 2026: price 1,293.00 GBp, trend uptrend, RSI 55.7, support 1,228.50, resistance 1,321.50.

Why Persimmon is in focus today
- One-day move of 0.00%, about 0.0× its average daily range (ATR)
Selected automatically from 10 LSE (UK) stocks by a technical-signal score with daily weighted randomisation — not a recommendation.
Trend and Price Action
The broader structure is constructive. The shares trade above both the 20-day simple moving average (SMA20) at 1,273.48 and the 50-day average (SMA50) at 1,223.81. The 20-day average sits above the 50-day, and the 20-day average itself rose 1.04% over five days. That combination describes an orderly uptrend rather than a one-day bounce. No new moving-average crossover has formed, so there is no fresh "golden cross" or "death cross" to point to; the trend is established, not newly signalled. The chart below shows where the close sits within that structure.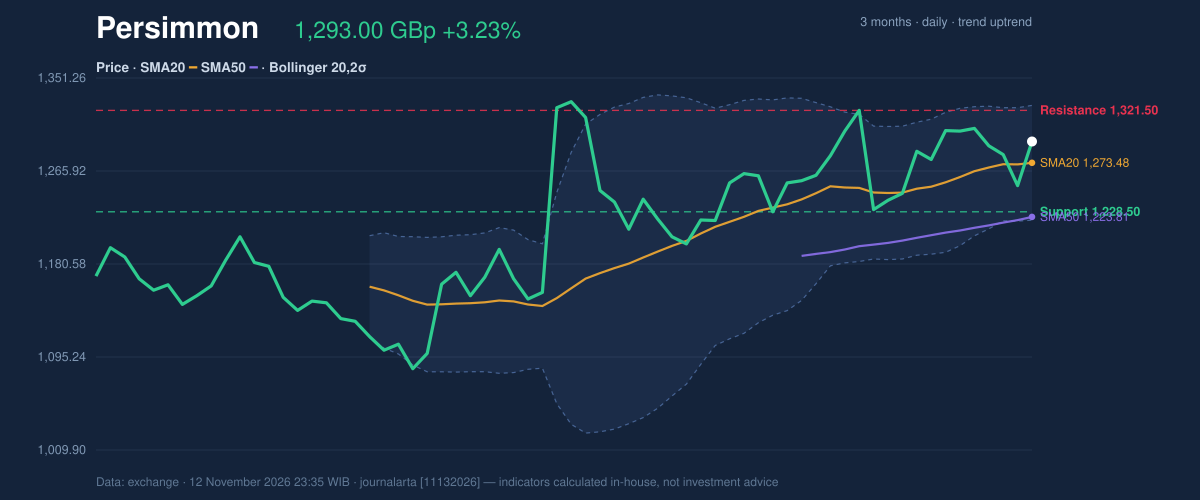
Oscillators and Momentum
Momentum indicators measure how strongly price is moving rather than where it is. Here they are unremarkable, and in one case unhelpful for bulls. The Relative Strength Index (RSI), a gauge from 0 to 100 where readings above 70 are considered stretched, stands at 55.7, firmly neutral. The Stochastic oscillator, which compares the close with the recent high-low range, shows %K at 61.7 and %D at 49.1. The faster line is above the slower one, a mild sign of improvement, but both remain in neutral territory. The MACD (moving average convergence divergence) is the cautious voice. The line is at 15.346 against a signal line of 17.881, leaving a histogram of -2.535. In plain terms, short-term momentum is running below its own recent average even though the price rose on the day. Code-based screening flags this as a bearish signal, noting the histogram has just turned negative. It is balanced by one bullish signal, a pullback to the SMA20 within an uptrend.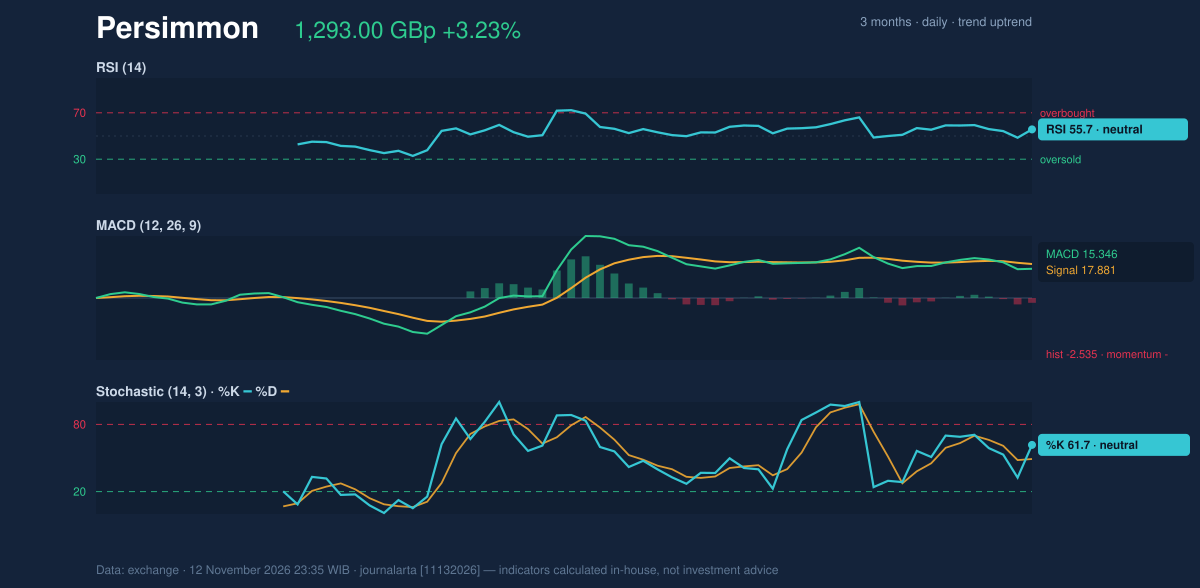
Volatility and Volume
1,220.81 at the bottom to 1,326.14 at the top, with the middle band at 1,273.48. The %B reading of 69% confirms the close is in the upper half of the channel, and the band width of 8.3% is normal, so the market is neither coiled for a sudden move nor already stretched. The Average True Range (ATR), a measure of typical daily movement, is 47.19 pence, or 3.6% of the price. That is high for a single stock. A day's swing of this size can easily erase a modest gain, which is why the 3.23% rise should be read in context. Volume tells a divided story. Thursday's turnover was 1.4 times average, a point in favour of the rally. But on-balance volume (OBV), which adds volume on up days and subtracts it on down days to track whether money is flowing in or out, is falling. That divergence suggests the broader accumulation behind the uptrend is not yet confirming it.Key Levels and Scenarios
Resistance at 1,321.50 is the first hurdle, sitting just above the upper Bollinger Band. Beyond it lies the three-month high at 1,362.50. On the downside, the SMA20 at 1,273.48 and 20-day support at 1,228.50 form two layers of cushion. The ATR-based bands, 1,222.22 below and 1,363.78 above, bracket roughly the same zone.Technical Verdict: HOLD (wait & see)
The JournalArta research score is +50 on a scale running from -100 to +100, short of the +60 threshold needed for a buy call and well above the -60 sell trigger. The verdict is HOLD (wait & see). The strongest reasons: - Trend: price above the SMA20 and SMA50, with the 20-day average above the 50-day, supports the uptrend. - MACD: the negative histogram of -2.535 shows momentum lagging the price. - OBV: falling on-balance volume does not confirm the rise despite heavier turnover. The verdict is invalidated if the price closes below 20-day support at 1,228.50. Conditional scenarios, drawn only from the reference levels: - Upside scenario: a close above 20-day resistance at 1,321.50 would be the entry zone; the exit target is the three-month high at 1,362.50; the stop-loss protection level is the SMA20 at 1,273.48. - Downside scenario: a break below 20-day support at 1,228.50 would open the path toward the lower Bollinger Band at 1,220.81 and, further out, the three-month low at 1,077.50; the protective level is the SMA20 at 1,273.48. This is technical analysis, not an investment recommendation. In plain terms, Persimmon's trend is still pointing up, but the evidence that buyers are fully in control is thin, so the chart argues for patience until the price either clears 1,321.50 or slips under 1,228.50.Summary Data Persimmon
| Last price | 1,293.00 GBp |
| Change 1 day / 5 days / 1 month | 3.23% / -0.73% / 2.33% |
| Trend / MA-cross | uptrend / none |
| SMA20 / SMA50 | 1,273.48 / 1,223.81 |
| RSI (14) / Stochastic %K | 55.7 / 61.7 |
| Bollinger %B / ATR | 69% / 47.19 |
| Support / Resistance 20 days | 1,228.50 / 1,321.50 |
| Data as of | 12 November 2026 23:35 WIB |
| JournalArta research verdict (score) | Hold (+50) |
Today's full Buy and Sell list for UK, Singapore & Hong Kong stocks →
Disclaimer: This technical analysis is generated automatically from exchange data and indicators calculated by JournalArta, for information and education only. The verdict and the entry, target and stop-loss levels are not investment advice or a solicitation to buy or sell any security. Investment decisions and their risks rest solely with the reader.
Track Persimmon share price daily: live levels, support/resistance and our full Persimmon analysis history.