Endeavour Mining Share Price Tumbles 8.46%: Trading Volume 1.5x Normal
Technical analysis of Endeavour Mining stock on November 12, 2026: price 3,778.00 GBp, trend sideways, RSI 41.8, support 3,557.00, resistance 4,284.00.
Endeavour Mining shares dropped 8.46% on the London Stock Exchange on Thursday, 12 November 2026, closing at 3,778.00 GBp against a previous close of 4,127.00 GBp. The fall extends a weak spell: the stock is down 5.86% over five days and 8.30% over one month. The market data does not say why it fell, so this analysis looks only at what the price, momentum and volume signals show.
Why Endeavour Mining is in focus today
- One-day move of 0.00%, about 0.0× its average daily range (ATR)
- Volume at 0.0× the 20-day average
Selected automatically from 10 LSE (UK) stocks by a technical-signal score with daily weighted randomisation — not a recommendation.
Trend and Price Action
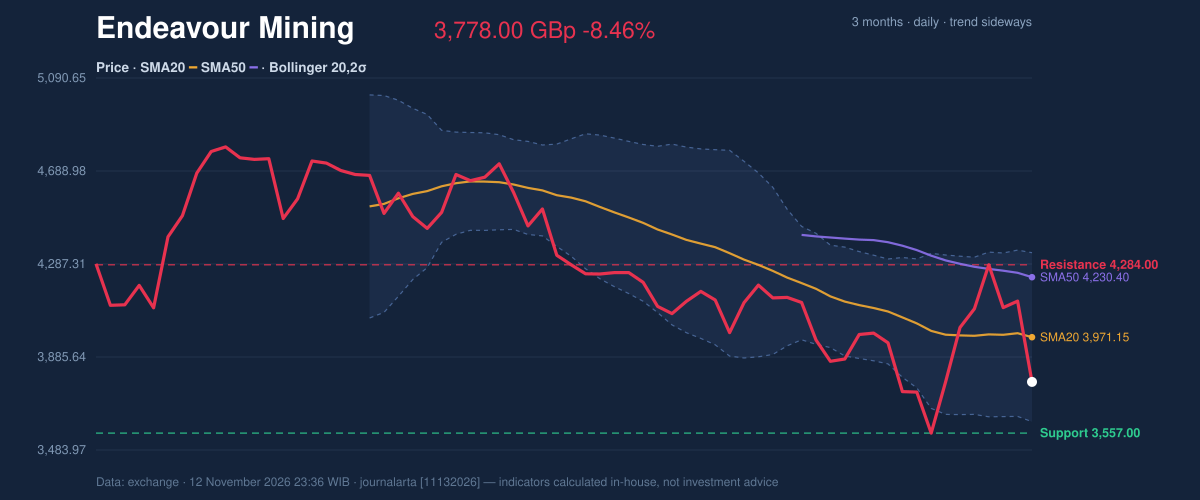
The shares now sit below both key moving averages. The 20-day simple moving average (SMA20) is at 3,971.15 GBp and the 50-day (SMA50) is at 4,230.40 GBp. Price below the SMA20 and an SMA20 under the SMA50 together describe a market where recent buyers are underwater on average. No new moving-average crossover has formed.
The broader trend reads as sideways rather than sharply falling. The 20-day average slipped 0.20% over five days, a gentle slope that shows the damage so far has come from one violent session, not a long grind lower.
That session still moved the shares to 30% of their 20-day range, between support at 3,557.00 GBp and resistance at 4,284.00 GBp. The three-month range runs from a low of 3,554.00 GBp to a high of 4,889.00 GBp. Thursday's close is only 224 pence above the three-month floor, as shown in the chart below.
Oscillators and Momentum
Momentum indicators are not flashing panic. The 14-day relative strength index (RSI), which measures the speed of recent gains against losses, stands at 41.8, in neutral territory. The stochastic oscillator is at 28.7 (%K) against 57.3 (%D); the fast line sits well below the slow line, which fits a market that has just turned down but has not hit an extreme.
The MACD, a gauge of the gap between short- and long-term averages, offers a mixed message. It stands at -56.216 against a signal line of -84.294, leaving a histogram of +28.079. A positive histogram means downside pressure is easing relative to the recent past. But with the MACD itself still below zero, that is a pause in selling, not a reversal.
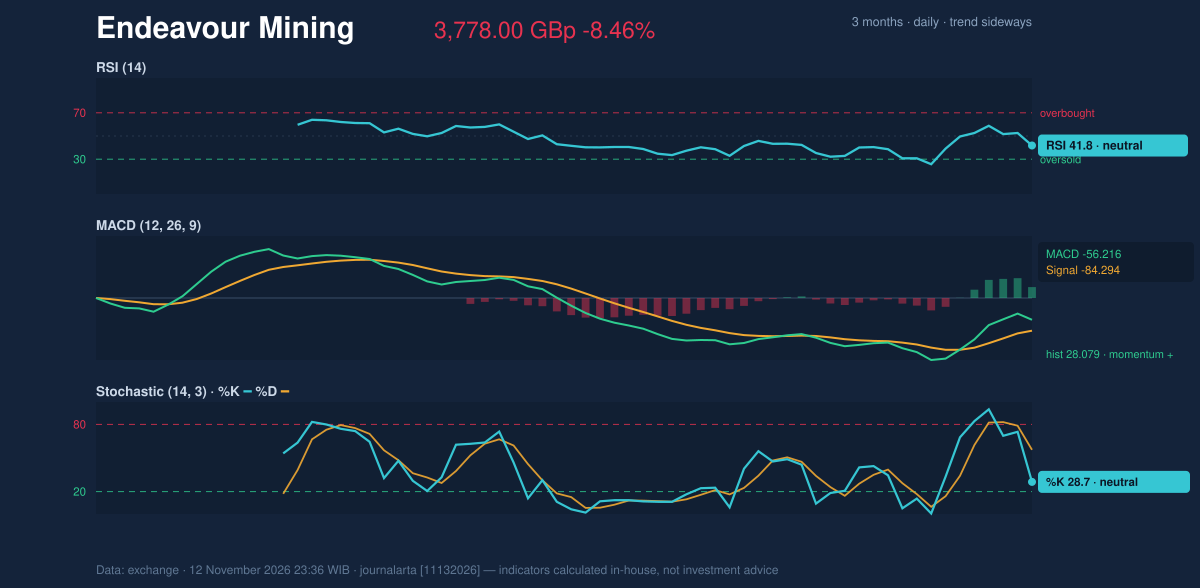
Put plainly, the indicators say the stock is weak but not yet stretched. That leaves room for further decline before oversold readings appear.
Volatility and Volume
Thursday's turnover was heavy. Volume reached 763,273 shares, about 1.5 times the 20-day average of 495,371. A large drop on above-average volume suggests real participation in the move rather than a thin-market air pocket.
On-balance volume (OBV), which adds volume on up days and subtracts it on down days, is still rising. That divergence leaves open whether some buyers were stepping in near the lows.
Volatility is high. The 14-day average true range (ATR) is 200.28 GBp, or 5.3% of the price, so daily swings of that size are normal for this stock. The Bollinger bands span 3,606.37 GBp to 4,335.93 GBp, with the midline at 3,971.15 GBp. Band width is 18.4%, a normal reading. The close sits at a %B of 24%, in the lower quarter of the bands but not through the floor.
Key Levels and Scenarios
The nearest floor is 20-day support at 3,557.00 GBp, which sits just above the three-month low of 3,554.00 GBp and below the lower Bollinger band at 3,606.37 GBp. A close beneath that zone would break the bottom of the three-month range. If the shares hold it, a rebound toward the SMA20 at 3,971.15 GBp is the obvious test. That area has now flipped from a floor into a ceiling.
The wider the bounce, the more it matters. Resistance at 4,284.00 GBp and the SMA50 at 4,230.40 GBp sit close together, which makes that area a heavy barrier.
Technical Verdict: SELL
JournalArta's research model rates Endeavour Mining SELL, with a score of -63 on a scale from -100 to +100, where -60 or lower triggers a sell call. The strongest reasons:
- Price below the SMA50 (4,230.40 GBp), with the 20-day average also below the 50-day.
- RSI at 41.8, in the 30–50 zone, which leaves room to fall before oversold conditions appear.
- Zero bullish technical signals against one bearish: a bounce into the SMA20 within a downtrend.
The levels below come from the code-computed verdict, valid until 10 December 2026:
- Entry range (sell zone): 3,778.00 – 3,928.17 GBp
- Exit target 1: 3,267.40 GBp (reward/risk 1.5)
- Exit target 2: 2,756.80 GBp (reward/risk 3.0)
- Stop loss: 4,118.40 GBp
Both targets sit below the 3,554.00 GBp three-month low, so reaching them would require the shares to break the floor. The verdict is invalidated if the price rises above 4,118.40 GBp. Counter-signals exist: the MACD histogram is positive and OBV is rising.
In plain terms, the technical picture leans negative and the stock would need to climb back above about 4,118 pence before that view loses its footing. This is technical analysis, not an investment recommendation.
Summary Data Endeavour Mining
| Last price | 3,778.00 GBp |
| Change 1 day / 5 days / 1 month | -8.46% / -5.86% / -8.30% |
| Trend / MA-cross | sideways / none |
| SMA20 / SMA50 | 3,971.15 / 4,230.40 |
| RSI (14) / Stochastic %K | 41.8 / 28.7 |
| Bollinger %B / ATR | 24% / 200.28 |
| Support / Resistance 20 days | 3,557.00 / 4,284.00 |
| Data as of | 12 November 2026 23:36 WIB |
| JournalArta research verdict (score) | Sell (-63) |
| Sell zone | 3,778.00 – 3,928.17 |
| Target 1 / 2 | 3,267.40 / 2,756.80 |
| Stop loss | 4,118.40 |
| Reward/risk | 1.5 / 3.0 |
Today's full Buy and Sell list for UK, Singapore & Hong Kong stocks →
Disclaimer: This technical analysis is generated automatically from exchange data and indicators calculated by JournalArta, for information and education only. The verdict and the entry, target and stop-loss levels are not investment advice or a solicitation to buy or sell any security. Investment decisions and their risks rest solely with the reader.
Track Endeavour Mining share price daily: live levels, support/resistance and our full Endeavour Mining analysis history.