Fresnillo Share Price on Thursday: Slides 2.98%, Trading Volume 1.6x Normal
Technical analysis of Fresnillo stock on November 12, 2026: price 2,444.00 GBp, trend downtrend, RSI 44.7, support 2,235.00, resistance 2,719.00.

For investors who follow London-listed precious metals miners, Fresnillo's Thursday session showed a stock that fell on heavier trading while its momentum gauges stayed mixed. Fresnillo closed the session of 12 November 2026 at 2,444.00 GBp, down 2.98% from the previous close of 2,519.00. Volume reached 1,231,004 shares, 1.6 times the 20-day average of 749,166. A drop on above-normal volume suggests sellers were active, not just absent buyers.
Why Fresnillo is in focus today
- One-day move of 0.00%, about 0.0× its average daily range (ATR)
- Volume at 0.0× the 20-day average
Selected automatically from 10 LSE (UK) stocks by a technical-signal score with daily weighted randomisation — not a recommendation.
Trend & Price Action
The longer picture is weaker than one day's move suggests. The shares are down 2.04% over five days and 8.43% over one month. The price sits below the 20-day average (SMA20) at 2,470.75, which in turn sits below the 50-day average (SMA50) at 2,698.38. That ordering is the textbook signature of a downtrend. The 20-day average itself fell 1.71% over five days, a measure of how quickly the recent trend line is sinking, not of the share price's own move. No new moving-average cross is flagged, so the bearish alignment is not a fresh event but an established one.
As the chart shows, the stock is trading well below the 3-month high of 3,310.42 and only modestly above the 3-month low of 2,219.00.
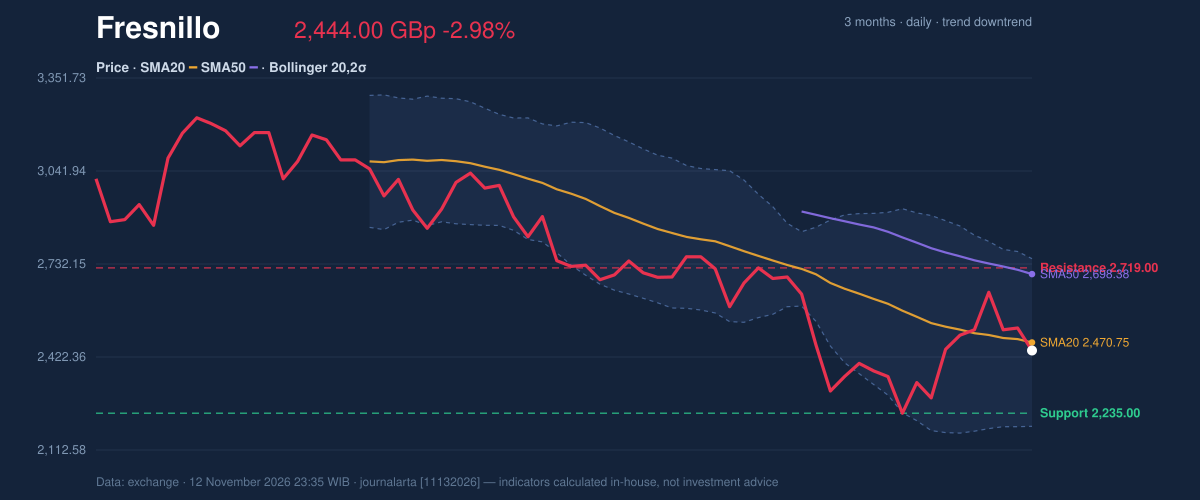
Within the last 20 sessions, the price sits at 43% of its range, between support at 2,235.00 and resistance at 2,719.00. That is mid-range, so the stock has neither washed out to the floor nor rebounded toward the ceiling. The one bearish signal the code detects is a bounce into the SMA20 within a downtrend. The SMA20 often acts as a ceiling in such conditions: rallies that stall there are usually read as sellers re-entering, not as a trend change.
Oscillators & Momentum
Momentum indicators do not confirm panic. The 14-day RSI (Relative Strength Index, a 0–100 gauge of recent buying versus selling pressure) reads 44.7, which counts as neutral. The Stochastic oscillator, which shows where the close sits within recent highs and lows, reads %K 50.1 and %D 60.8, also neutral. The %K line below %D hints that short-term momentum is cooling.
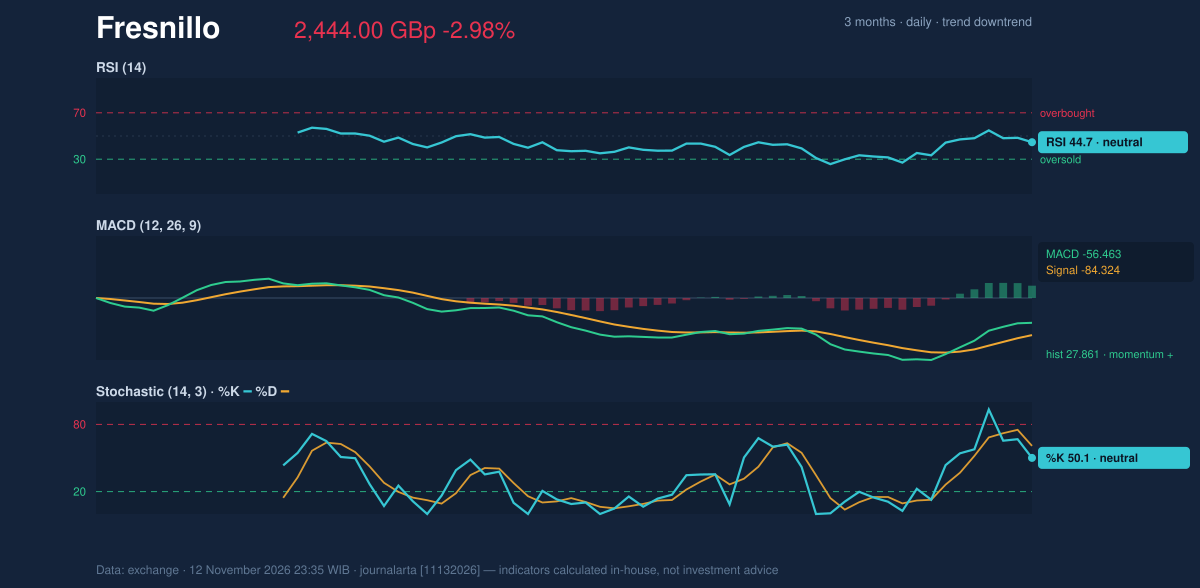
The MACD (a trend-following gauge built from two moving averages) is more nuanced. The line stands at -56.463, below its signal line of -84.324, but the histogram is +27.861. A negative MACD with a positive histogram means the downward pressure is easing even though the trend remains negative. Put simply, the decline is slowing, not reversing. That is why the RSI sits in the 30–50 zone instead of near oversold levels: the stock has weakened without being stretched.
Volatility & Volume
Bollinger Bands (a channel two standard deviations around the 20-day average) run from 2,191.55 at the bottom to 2,749.95 at the top. The bands are widening, with a width of 22.6%, which signals high volatility. The %B reading of 45% puts the price just below the middle band at 2,470.75. The 14-day ATR (Average True Range, the typical daily swing) is 117.18, or 4.8% of the price. For a holder, that means a single ordinary session can move the stock by roughly 117 GBp in either direction, so short-term rebounds should not be mistaken for trend changes.
Volume adds a counterpoint. The OBV (On-Balance Volume, a running tally of volume on up versus down days) is rising, even as the price falls. Rising OBV in a falling market can mean accumulation by some participants, but it has not yet turned the price trend. Until the price reclaims its averages, the volume signal remains a question mark rather than a confirmation.
Key Levels & Scenarios
The nearest floor is the 20-day support at 2,235.00, just above the 3-month low of 2,219.00. A close beneath those levels would extend the downtrend, with the lower Bollinger Band at 2,191.55 the next reference. On the upside, a sustained move above the SMA20 at 2,470.75 would be the first sign that the pressure is fading. A reclaim of the SMA50 at 2,698.38, close to the 20-day resistance of 2,719.00, would be needed to change the structure.
Technical Verdict: SELL
JournalArta's research model scores Fresnillo at -73 on a scale of -100 to +100, below the -60 threshold that triggers a SELL call. The strongest reasons are:
- Price below the 50-day average (2,698.38) and the 20-day average below the 50-day: a classic downtrend structure.
- Falling 20-day average (-1.71% over five days) and a one-month decline of 8.43%.
- RSI at 44.7, in the 30–50 zone that fits a weak but not oversold trend.
The verdict is invalidated if the price closes above the stop loss at 2,643.02. The levels are:
- Entry range (sell zone): 2,444.00 – 2,531.80
- Exit target 1: 2,145.47 (reward/risk 1.5)
- Exit target 2: 1,846.94 (reward/risk 3.0)
- Stop loss: 2,643.02
This is technical analysis, not an investment recommendation. In plain terms, the chart shows a stock still in a downtrend, and the signal stays in force until 10 Dec 2026 unless the stop level is breached first.
Summary Data Fresnillo
| Last price | 2,444.00 GBp |
| Change 1 day / 5 days / 1 month | -2.98% / -2.04% / -8.43% |
| Trend / MA-cross | downtrend / none |
| SMA20 / SMA50 | 2,470.75 / 2,698.38 |
| RSI (14) / Stochastic %K | 44.7 / 50.1 |
| Bollinger %B / ATR | 45% / 117.18 |
| Support / Resistance 20 days | 2,235.00 / 2,719.00 |
| Data as of | 12 November 2026 23:35 WIB |
| JournalArta research verdict (score) | Sell (-73) |
| Sell zone | 2,444.00 – 2,531.80 |
| Target 1 / 2 | 2,145.47 / 1,846.94 |
| Stop loss | 2,643.02 |
| Reward/risk | 1.5 / 3.0 |
Today's full Buy and Sell list for UK, Singapore & Hong Kong stocks →
Disclaimer: This technical analysis is generated automatically from exchange data and indicators calculated by JournalArta, for information and education only. The verdict and the entry, target and stop-loss levels are not investment advice or a solicitation to buy or sell any security. Investment decisions and their risks rest solely with the reader.
Track Fresnillo share price daily: live levels, support/resistance and our full Fresnillo analysis history.