Intermediate Capital Share Price on Thursday: Slides 3.79%, Down 2.9% in Five Sessions
Technical analysis of ICG stock on November 12, 2026: price 1,880.00 GBp, trend uptrend, RSI 50.8, support 1,774.00, resistance 1,982.00.

Shares in Intermediate Capital Group (ICG.L) fell 3.79% on the London Stock Exchange on Thursday, November 12, 2026, closing at 1,880.00 pence against a previous close of 1,954.00. The drop is the surface story. Underneath, the 20-day moving average has just crossed above the 50-day, and the stock has slid back to its short-term average rather than breaking down. That combination is what makes the chart worth reading.
Why ICG is in focus today
- One-day move of 0.00%, about 0.0× its average daily range (ATR)
Selected automatically from 10 LSE (UK) stocks by a technical-signal score with daily weighted randomisation — not a recommendation.
Trend & Price Action
Over one month the shares are still up 5.26%, even after the five-day slide of 2.94%. The 20-day average (SMA20) sits at 1,862.20 pence and the 50-day (SMA50) at 1,853.20. Price is above both, and the 20-day average rose 1.86% over five days. That is the slope of the average, not the share price's own move.
The golden cross formed one session before the latest session. A golden cross happens when the faster average climbs through the slower one, a sign that recent prices are running ahead of the longer-term trend. It is a lagging signal and the gap between the two lines is only 9 pence, so it is a thin cushion. Still, the latest dip stopped almost exactly on the SMA20, the textbook "pullback within an uptrend" pattern.
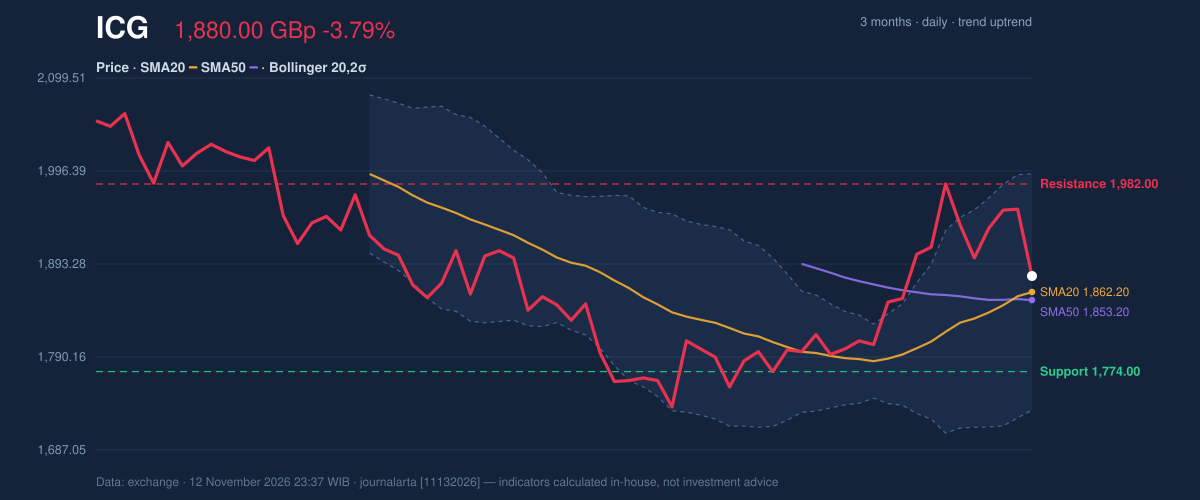
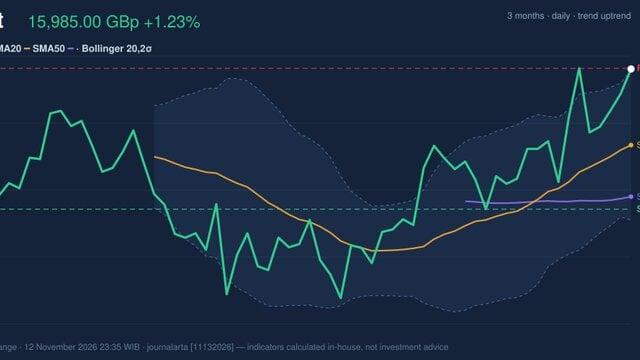
As shown in the chart, the shares sit at 51% of their 20-day range, between support at 1,774.00 and resistance at 1,982.00. The wider three-month range runs from 1,600.00 to 2,092.00, so the stock is mid-field, not stretched toward either extreme.
Oscillators & Momentum
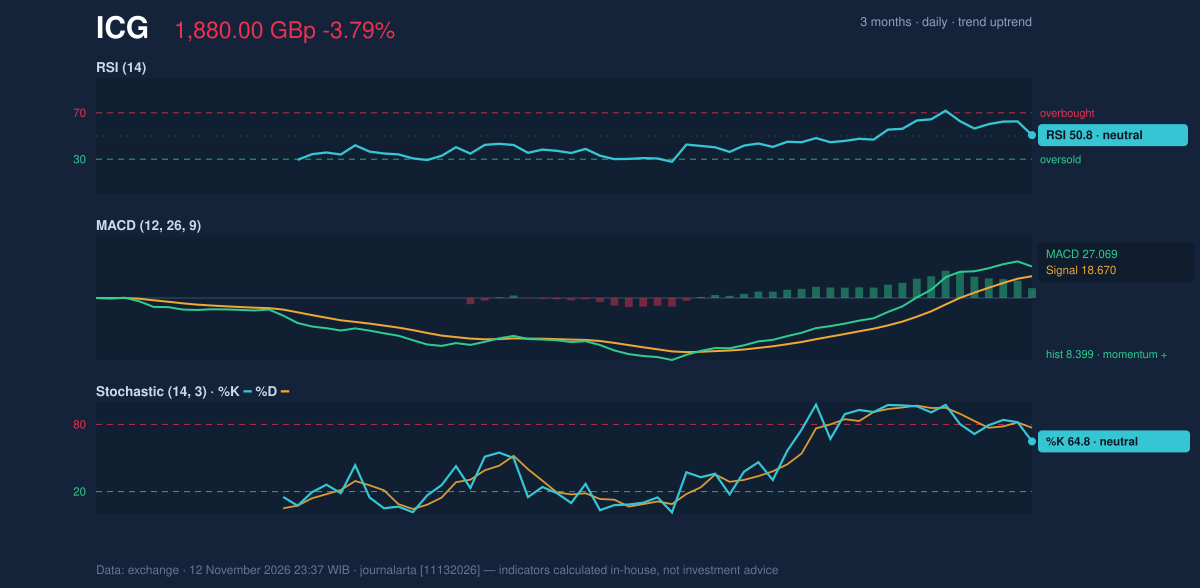
The momentum gauges show a market that has cooled without turning. The 14-day RSI reads 50.8, neutral, meaning recent gains and losses are roughly balanced. Stochastic %K is 64.8 against %D at 76.9, also neutral. %K below %D shows short-term momentum fading, which fits a one-day pullback.
The MACD line is at 27.069 against a signal line of 18.670, leaving a histogram of 8.399. A positive histogram means the faster momentum line is still above its slower trigger. Put simply, the trend's engine has slowed but not stalled.
Volatility & Volume
Bollinger Bands (20 days, 2 standard deviations) span 1,731.22 to 1,993.18, with the midline at 1,862.20. Price sits at 57% of the band, and the band width of 14.1% is normal, so there is no squeeze pointing to an imminent breakout.
Daily swings are not small, though. The 14-day Average True Range (ATR) is 78.29 pence, or 4.2% of the price, which counts as high volatility. A move of that size in a day is routine for this stock, so tight risk limits can be triggered by noise.
Volume leans toward the bulls. Thursday's turnover was 1,340,511 shares, 1.3 times the 20-day average of 1,023,448. A heavy-volume decline can signal real selling. Here, however, On-Balance Volume (OBV), a running tally of volume on up days versus down days, is still rising. That suggests the broader flow has favoured buyers, and the drop looks more like profit-taking than a change of mind.
Key Levels & Scenarios
The nearest floor is the SMA20 at 1,862.20 pence, with the SMA50 at 1,853.20 just below it. Beyond that, 20-day support at 1,774.00 matters most. If the shares hold the moving averages, the 20-day resistance at 1,982.00 and the upper Bollinger Band at 1,993.18 come into view as the next hurdles. If they lose the averages and then 1,774.00, the golden cross would look premature.
Technical Verdict: BUY
JournalArta's research model scores ICG at +74 on a scale of −100 to +100, above the +60 threshold for a BUY call. Three bullish signals are active and none are bearish. The strongest reasons:
- Golden cross: the SMA20 has moved above the SMA50, with price above both.
- Pullback to the SMA20: the dip landed on the 20-day average inside an uptrend.
- OBV rising: volume flow confirms the uptrend despite the 3.79% one-day decline.
Levels computed from the data, valid until 10 December 2026:
- Entry range: 1,821.35 – 1,880.00 pence
- Exit target 1: 2,079.44 pence (reward/risk 1.5)
- Exit target 2: 2,278.88 pence (reward/risk 3.0)
- Stop loss: 1,747.04 pence
The verdict is invalidated if price falls below 1,747.04, which would also mean losing the 20-day support at 1,774.00.
In plain terms: the chart currently leans toward further gains, but with daily swings of about 4%, the call holds only while the stock stays above that stop level. This is technical analysis, not investment advice.
Summary Data ICG
| Last price | 1,880.00 GBp |
| Change 1 day / 5 days / 1 month | -3.79% / -2.94% / 5.26% |
| Trend / MA-cross | uptrend / golden |
| SMA20 / SMA50 | 1,862.20 / 1,853.20 |
| RSI (14) / Stochastic %K | 50.8 / 64.8 |
| Bollinger %B / ATR | 57% / 78.29 |
| Support / Resistance 20 days | 1,774.00 / 1,982.00 |
| Data as of | 12 November 2026 23:37 WIB |
| JournalArta research verdict (score) | Buy (+74) |
| Entry zone | 1,821.35 – 1,880.00 |
| Target 1 / 2 | 2,079.44 / 2,278.88 |
| Stop loss | 1,747.04 |
| Reward/risk | 1.5 / 3.0 |
Today's full Buy and Sell list for UK, Singapore & Hong Kong stocks →
Disclaimer: This technical analysis is generated automatically from exchange data and indicators calculated by JournalArta, for information and education only. The verdict and the entry, target and stop-loss levels are not investment advice or a solicitation to buy or sell any security. Investment decisions and their risks rest solely with the reader.
Track ICG share price daily: live levels, support/resistance and our full ICG analysis history.