Next Share Price Rises 1.23% on Thursday, Near a 3-Month High
Technical analysis of Next stock on November 12, 2026: price 15,985.00 GBp, trend uptrend, RSI 63.3, support 14,880.00, resistance 15,990.00.
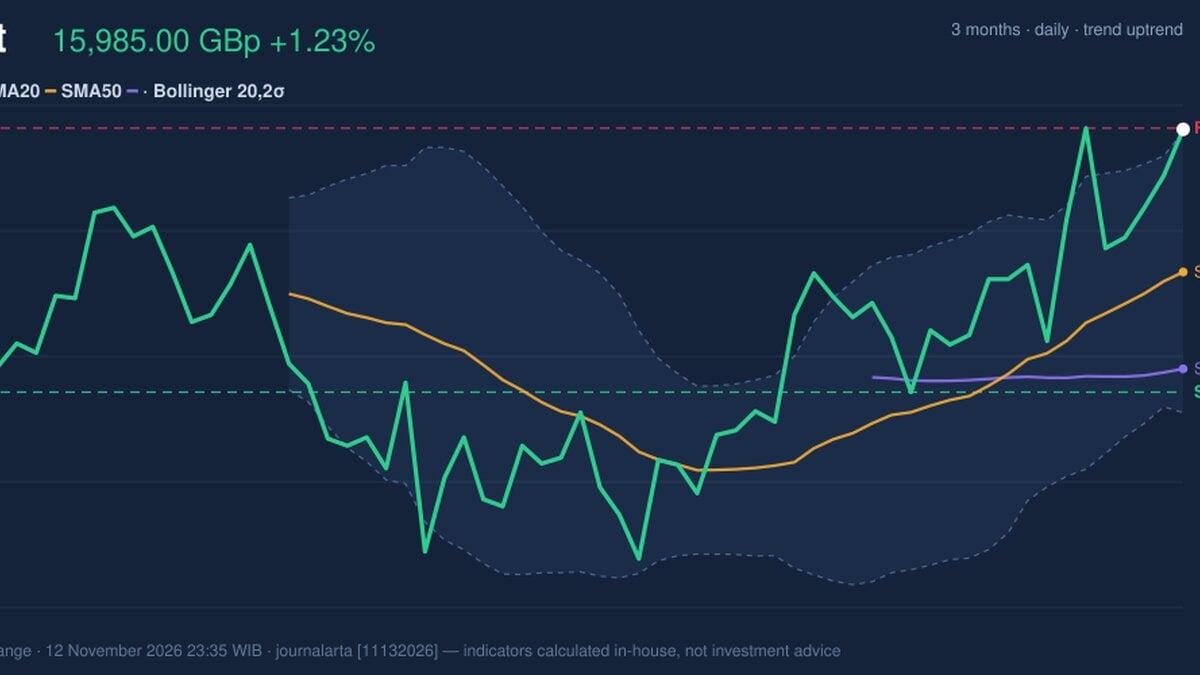
Next plc closed Thursday's London session at 15,985.00 GBp, up 1.23% from a previous close of 15,790.00, and a single pence below the 20-day resistance of 15,990.00. The move extends a one-month gain of 5.13%, even though the five-day change is flat at -0.03%. Three of the selection signals point up: a pullback to the 20-day average inside an uptrend, a Bollinger squeeze resolved with a close above the upper band, and rising on-balance volume. One points down, an RSI rolling over from above 65.
Why Next is in focus today
Selected automatically from 10 LSE (UK) stocks by a technical-signal score with daily weighted randomisation — not a recommendation.
That mix matters. The stock is strong, and it is also stretched.
Trend & Price Action
The structure is a clean uptrend. The price sits above the 20-day simple moving average (SMA20) at 15,385.00, which in turn sits above the 50-day average at 14,978.40. When the faster average stays above the slower one, buyers have been paying progressively higher prices for weeks. No new crossover has formed, so there is no fresh "golden cross" to cite; the trend is established rather than newly triggered.
The 20-day average itself rose 1.41% over five days. That is the slope of the average, not the share price's gain, and it shows the trend's backbone is still tilting upward even as the five-day price change sits at zero. The gap between price and SMA20 is roughly 600 pence, or about 4%, a stretch that has historically tended to be resolved either by a pause or by a pullback toward the average.
As shown in the chart below, the price is pressing against the top of its recent range.
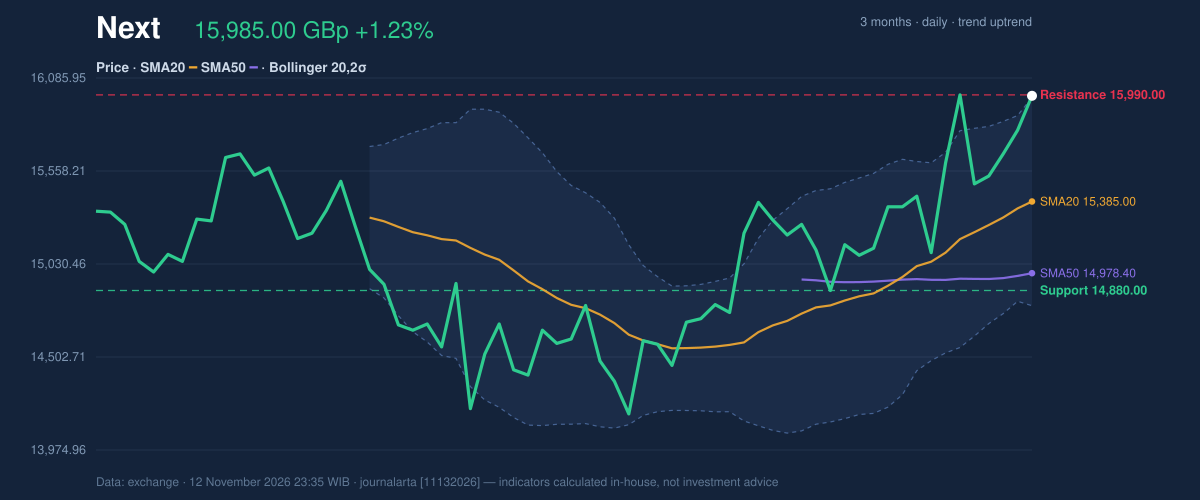
The 20-day support is 14,880.00 and resistance is 15,990.00, so the stock trades at 100% of its 20-day range. The three-month high is 16,125.00 and the low is 14,000.00. Only about 140 pence separate the current price from the three-month peak. A close above 15,990.00 would put that high in play; failure to hold would leave the 20-day average as the first area of support.
Oscillators & Momentum
Momentum confirms the trend but flags fatigue. The RSI(14) reads 63.3, classed as neutral. It is strong without being overbought, which leaves room to climb. The Stochastic %K at 89.0, above %D at 75.8, is overbought. The Stochastic compares the close with the recent high-low range, so a reading near 89 simply says the stock is finishing near the top of that range. In strong trends, it can stay there for a while.
The MACD offers more support. The line sits at 238.457 against a signal line of 186.211, a histogram of 52.246. A positive and widening gap means short-term momentum is outrunning longer-term momentum, the usual signature of an advancing trend.
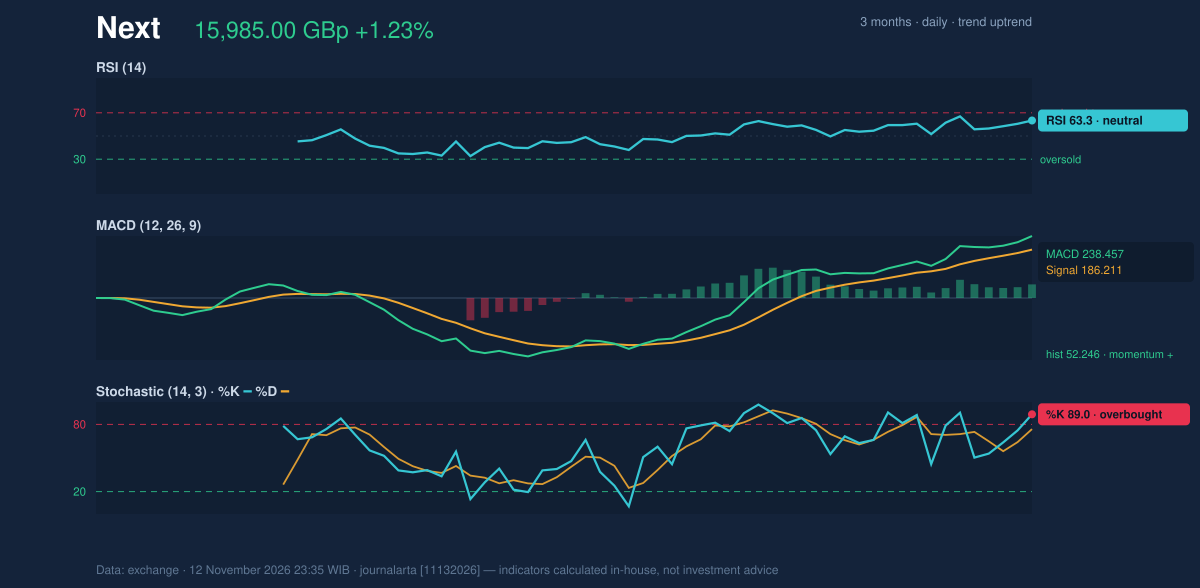
The one bearish flag, RSI rolling over from above 65, is worth reading carefully. RSI at 63.3 is below that threshold, so the flag says momentum has cooled slightly from a recent higher reading even as price made a new push. That is a mild divergence, not a reversal.
Volatility & Volume
The Bollinger Bands (20 days, 2 standard deviations) span 14,793.87 to 15,976.13, with the midline at 15,385.00. The last price of 15,985.00 is just above the upper band, giving a %B of 101%. Band width is 7.7% and narrowing, the classic squeeze, which describes a period of unusually low volatility. The close above the upper band suggests that squeeze has resolved to the upside. Closes above the band can signal strength, though they also tend to invite a retest of the band.
The average true range (ATR, 14 days) is 408.98 pence, 2.6% of the price, a moderate level of volatility. Daily swings of that size mean a stop placed too tight can be triggered by ordinary noise.
Volume is the soft spot. Thursday's 177,019 shares traded were 0.6 times the 20-day average of 278,509. A breakout on thin volume carries less conviction than one on heavy volume. On-balance volume, which adds volume on up days and subtracts it on down days, is still rising, so the longer accumulation pattern remains intact.
Key Levels & Scenarios
If the price closes decisively above 15,990.00, the next reference is the three-month high of 16,125.00. If it fails to hold the upper Bollinger band near 15,976.13, the 20-day average at 15,385.00 and the support at 14,880.00 come into view. Light volume raises the odds of such a pullback.
Technical Verdict: BUY
JournalArta's research model scores Next at +66 on a scale of -100 to +100, above the +60 threshold for a BUY reading. The strongest reasons:
- Trend: price is above the 50-day average and the 20-day average is above the 50-day, an established uptrend.
- Signal balance: three bullish technical signals against one bearish, including a resolved Bollinger squeeze and rising OBV.
- MACD: the line is above its signal, with a positive histogram of 52.246.
Levels computed by the model, valid until 10 December 2026:
- Entry range: 15,678.09 – 15,985.00
- Exit target 1: 17,028.50 (reward/risk 1.5)
- Exit target 2: 18,072.01 (reward/risk 3.0)
- Stop loss: 15,289.33
The verdict is invalidated if the price falls below 15,289.33. The main risks are the overbought Stochastic at 89.0 and volume at 0.6 times normal.
In plain terms: the chart still favours the upward trend, but the stock has run hard and thin volume means it may pause first. This is technical analysis, not investment advice.
| Indicator | Value |
|---|---|
| Last price | 15,985.00 GBp |
| Change (1 day / 5 days / 1 month) | 1.23% / -0.03% / 5.13% |
| SMA20 / SMA50 | 15,385.00 / 14,978.40 |
| Bollinger (upper / middle / lower) | 15,976.13 / 15,385.00 / 14,793.87 |
| RSI(14) | 63.3 |
| Stochastic %K / %D | 89.0 / 75.8 |
| MACD / signal / histogram | 238.457 / 186.211 / 52.246 |
| ATR(14) | 408.98 |
| Volume vs 20-day average | 177,019 vs 278,509 (0.6×) |
| 20-day support / resistance | 14,880.00 / 15,990.00 |
| 3-month high / low | 16,125.00 / 14,000.00 |
The model's levels stay valid until 10 December 2026.
Summary Data Next
| Last price | 15,985.00 GBp |
| Change 1 day / 5 days / 1 month | 1.23% / -0.03% / 5.13% |
| Trend / MA-cross | uptrend / none |
| SMA20 / SMA50 | 15,385.00 / 14,978.40 |
| RSI (14) / Stochastic %K | 63.3 / 89.0 |
| Bollinger %B / ATR | 101% / 408.98 |
| Support / Resistance 20 days | 14,880.00 / 15,990.00 |
| Data as of | 12 November 2026 23:35 WIB |
| JournalArta research verdict (score) | Buy (+66) |
| Entry zone | 15,678.09 – 15,985.00 |
| Target 1 / 2 | 17,028.50 / 18,072.01 |
| Stop loss | 15,289.33 |
| Reward/risk | 1.5 / 3.0 |
Today's full Buy and Sell list for UK, Singapore & Hong Kong stocks →
Disclaimer: This technical analysis is generated automatically from exchange data and indicators calculated by JournalArta, for information and education only. The verdict and the entry, target and stop-loss levels are not investment advice or a solicitation to buy or sell any security. Investment decisions and their risks rest solely with the reader.
Track Next share price daily: live levels, support/resistance and our full Next analysis history.