ConvaTec Share Price on Thursday: Rises 0.95%, Trading Volume 1.8x Normal
Technical analysis of ConvaTec stock on November 12, 2026: price 255.80 GBp, trend uptrend, RSI 70.1, support 235.40, resistance 255.80.
ConvaTec Group finished Thursday's session on the London Stock Exchange at 255.80 pence, up 0.95% on the day and level with its 20-day high. The move came on volume of 12,909,991 shares, 1.8 times the 20-day average of 7,093,743. A close above a recent high on heavy turnover is the kind of breakout that technical analysts treat as real participation rather than drift. The figures below refer to the session of Thursday, November 12, 2026.
Why ConvaTec is in focus today
- Volume at 0.0× the 20-day average
Selected automatically from 10 LSE (UK) stocks by a technical-signal score with daily weighted randomisation — not a recommendation.
Trend and Price Action
The stock is up 1.11% over five days and 8.02% over one month. That gain has built steadily rather than in a single jump. The price sits above the 20-day simple moving average (SMA20) of 245.48 and the 50-day average (SMA50) of 229.78. The 20-day average itself rose 2.16% over five days, so the short-term trend is still accelerating. The SMA20 remains above the SMA50, but no new crossover has formed. The bullish alignment is established, not fresh.
Support over 20 days is 235.40 and resistance is 255.80, which puts the price at 100% of its range. The three-month high is 258.60 and the low is 209.20, so the shares sit about 2.8 pence below their recent peak.
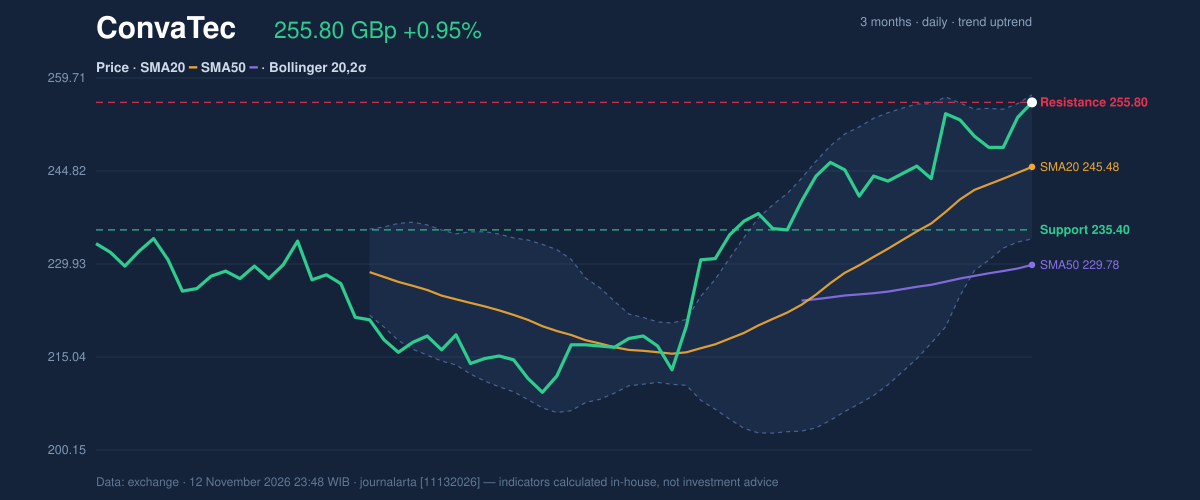
As the chart shows, the price has pushed up against the upper Bollinger Band. The bands are drawn two standard deviations around the 20-day average, and the upper band stands at 257.01. The %B reading of 95% means the price is almost at the top of its normal range. Band width of 9.4% is normal, so this is a steady grind higher, not a volatility spike.
Oscillators and Momentum
The momentum gauges agree with the trend, which is also a warning. The Relative Strength Index (RSI), which compares recent gains with recent losses, reads 70.1, just inside overbought territory. The Stochastic oscillator, which shows where the close sits in its recent range, has %K at 85.6 and %D at 71.8. Both are overbought.
Overbought does not mean a reversal is due. In a healthy uptrend, these readings can stay elevated for weeks. What they do signal is that the move has used up much of its short-term energy, and that small pullbacks are more likely than a smooth climb.
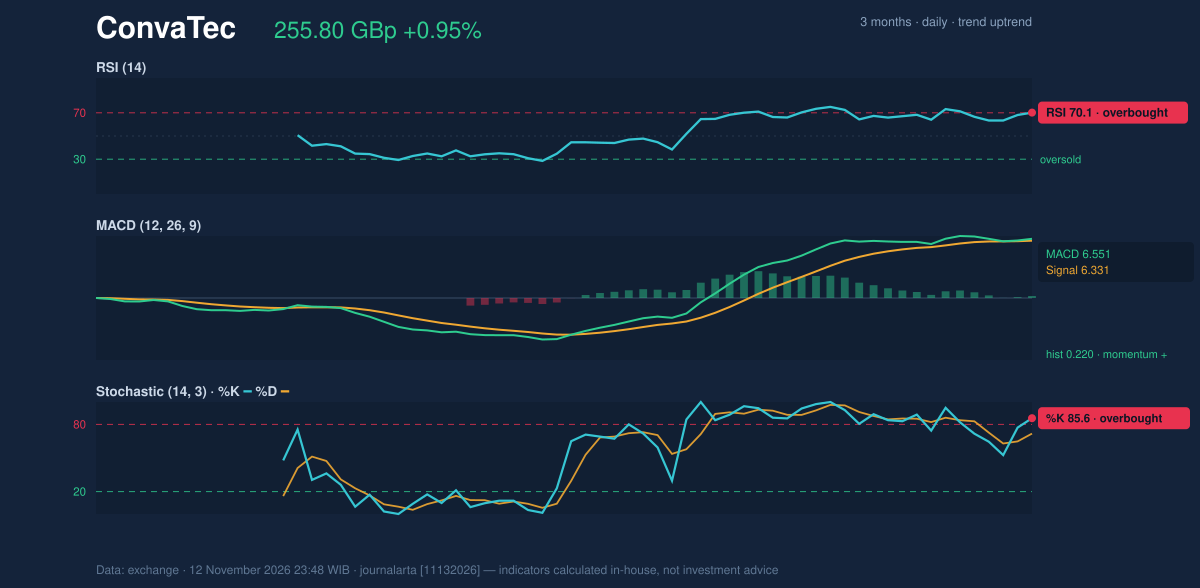
The MACD line is at 6.551 against a signal line of 6.331, and the histogram of 0.220 is positive. MACD tracks the gap between fast and slow averages. A positive histogram says momentum still leans upward, though the 0.220 gap is narrow, so the cushion is thin.
Volatility and Volume
The 14-day Average True Range (ATR) is 5.75 pence, or 2.2% of the price. That is moderate volatility: a typical day moves about 5 to 6 pence. For anyone sizing a position, it shows why a stop placed too close would likely be hit by ordinary noise.
Volume is the strongest piece of evidence. Turnover of 1.8 times the average on a close above the 20-day high is a classic confirmation. On-Balance Volume (OBV), which adds volume on up days and subtracts it on down days, is rising. Buyers, not just thin trading, are behind the price.
Key Levels and Scenarios
The nearest test is the 258.60 three-month high. A close above it would extend the breakout. If the stock fails to hold the 20-day average at 245.48, the breakout loses credibility, with 235.40 support as the next floor.
Technical Verdict: BUY
The JournalArta research score is +71 on a scale of −100 to +100. The Buy threshold is +60. The call is BUY on a technical basis.
- Trend: price is above both the 20-day and 50-day averages, with the 20-day average above the 50-day.
- Volume: the close above the 20-day high came on 1.8 times average volume, and OBV is rising.
- Signal count: two bullish technical signals against zero bearish.
The levels are:
- Entry range: 251.49 – 255.80
- Exit target 1: 270.48 (reward/risk 1.5)
- Exit target 2: 285.17 (reward/risk 3.0)
- Stop loss: 246.01
The verdict is invalidated if the price falls below 246.01, and the call is valid until 10 December 2026. The main risk is that RSI at 70.1 and Stochastic %K at 85.6 point to a stretched short-term move.
In plain terms, the chart favours further gains, but the stock has already run hard, so a short pause would not be surprising. This is technical analysis, not investment advice.
Summary Data ConvaTec
| Last price | 255.80 GBp |
| Change 1 day / 5 days / 1 month | 0.95% / 1.11% / 8.02% |
| Trend / MA-cross | uptrend / none |
| SMA20 / SMA50 | 245.48 / 229.78 |
| RSI (14) / Stochastic %K | 70.1 / 85.6 |
| Bollinger %B / ATR | 95% / 5.75 |
| Support / Resistance 20 days | 235.40 / 255.80 |
| Data as of | 12 November 2026 23:48 WIB |
| JournalArta research verdict (score) | Buy (+71) |
| Entry zone | 251.49 – 255.80 |
| Target 1 / 2 | 270.48 / 285.17 |
| Stop loss | 246.01 |
| Reward/risk | 1.5 / 3.0 |
Today's full Buy and Sell list for UK, Singapore & Hong Kong stocks →
Disclaimer: This technical analysis is generated automatically from exchange data and indicators calculated by JournalArta, for information and education only. The verdict and the entry, target and stop-loss levels are not investment advice or a solicitation to buy or sell any security. Investment decisions and their risks rest solely with the reader.
Track ConvaTec share price daily: live levels, support/resistance and our full ConvaTec analysis history.