Prudential Share Price on Thursday: Falls 0.34%, Down 1.6% in Five Sessions
Technical analysis of Prudential stock on November 19, 2026: price 942.40 GBp, trend uptrend, RSI 51.6, support 880.80, resistance 969.40.

Why Prudential is in focus today
Selected automatically from 10 LSE (UK) stocks by a technical-signal score with daily weighted randomisation — not a recommendation.
Trend & Price Action
The structural signal arrived in the latest session: a golden cross, with the 20-day moving average (934.32) crossing above the 50-day average (931.46). For general readers, that pattern is read as a shift in the medium-term direction of travel — the short-term trend has now overtaken the longer one. The 20-day average itself rose 1.60% over five days, so the line is sloping upward, not merely being crossed by a falling counterpart. Price sits above both averages, at 70% of the 20-day range between support at 880.80 and resistance at 969.40. That position matters: it leaves room toward resistance but also cushions against a quick slide before support is tested. The three-month high of 1,052.50 remains well overhead, while the low of 867.40 frames the floor of the recent range.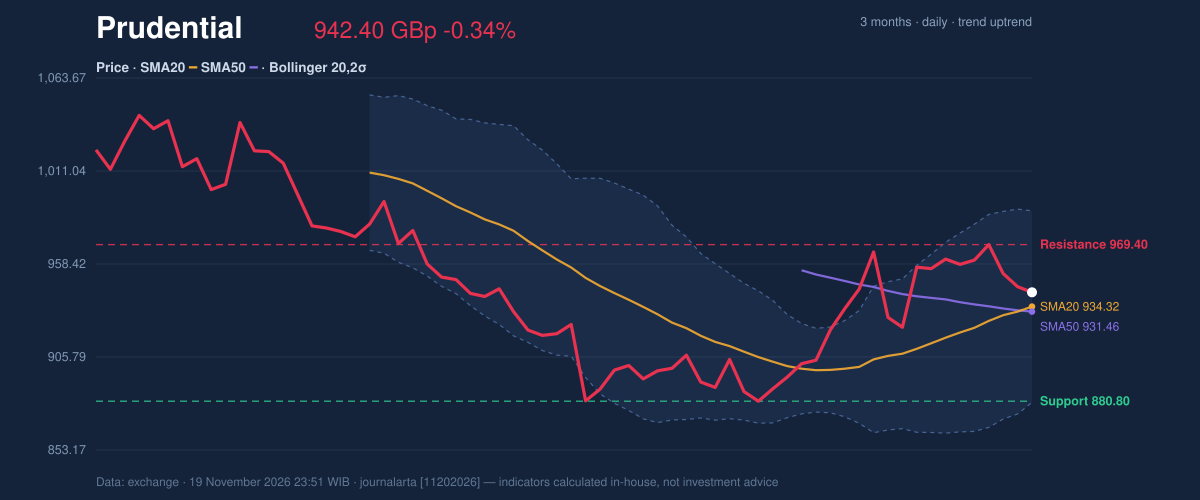
Oscillators & Momentum
Momentum is cautiously constructive rather than exuberant. RSI(14) at 51.6 is textbook neutral — neither overbought nor oversold, so no exhaustion signal is pulling the price either way. The MACD is the more telling indicator here: at 8.443 against a signal line of 6.719, the histogram sits positive at 1.724, confirming that upside momentum is intact. Stochastic offers the counterpoint: %K at 37.4 below %D at 46.2 shows the fast measure cooling toward the lower half of its range. Read together, the picture is a trend that has not been overstretched — the cooling in Stochastic looks like digestion, not breakdown, precisely because MACD remains aligned with the uptrend.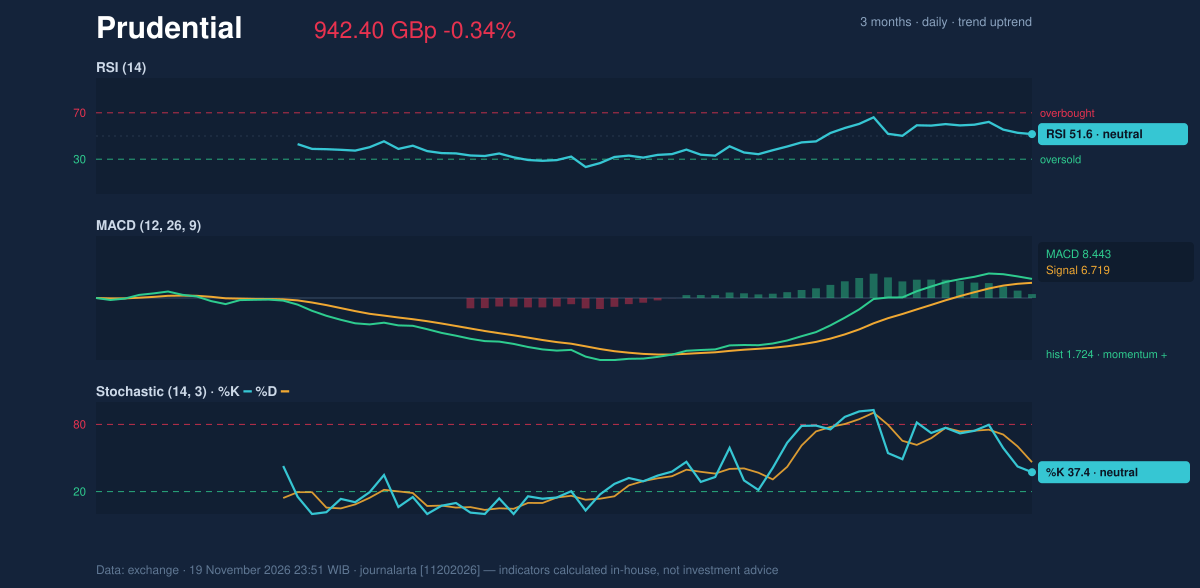
Volatility & Volume
Bollinger bands on the 20-day, two-standard-deviation setting span 880.10 to 988.54, a width of 11.6% — normal by the data's own classification, neither squeezed nor expanded. The stock's %B of 57% places it just above the middle of that channel, consistent with the neutral RSI reading. ATR(14) of 23.77, or 2.5% of the price, describes moderate volatility: daily swings of this size are ordinary for the name and do not by themselves threaten the trend. The defining tension is volume. A bullish structure confirmed on 0.5× average volume and a falling OBV is a participation question the market has not yet answered. Thin turnover leaves the door open either way — a single heavy session could validate the golden cross, or another week of quiet drift could erode it.Key Levels & Scenarios
Support at 880.80 coincides closely with the lower Bollinger band at 880.10, making that a zone rather than a line. Resistance at 969.40 stands just below the upper band at 988.54. If the stock clears 969.40 on rising volume, the path toward the upper band and then the three-month high opens; if it fails to hold the 20-day average at 934.32, attention turns back to the 880.80 support and the case for the golden cross weakens.Technical Verdict: BUY
The JournalArta research verdict is BUY, scoring +74 on a −100 to +100 scale, driven by price above the 50-day average, two bullish indicators against zero bearish, the 20-day average above the 50-day, and the uptrend. The three strongest supports for that call are the fresh golden cross, the positive MACD histogram at 1.724, and the fact that price is holding above both moving averages. The verdict is invalidated if price breaks below 902.02. - Entry range: 924.59 – 942.40 - Exit targets: 1,002.97 and 1,063.54 - Stop loss: 902.02 - Reward/risk: 1.5 / 3.0; levels valid until December 17, 2026 In plain terms: the trend structure says the path of least resistance is higher, but the quiet volume means patience rather than urgency is the appropriate posture. "The market has handed Prudential a golden cross on half its normal turnover," one London-based trader said. "Now we find out whether anyone is actually willing to pay up for it."Summary Data Prudential
| Last price | 942.40 GBp |
| Change 1 day / 5 days / 1 month | -0.34% / -1.65% / 6.34% |
| Trend / MA-cross | uptrend / golden |
| SMA20 / SMA50 | 934.32 / 931.46 |
| RSI (14) / Stochastic %K | 51.6 / 37.4 |
| Bollinger %B / ATR | 57% / 23.77 |
| Support / Resistance 20 days | 880.80 / 969.40 |
| Data as of | 19 November 2026 23:51 WIB |
| JournalArta research verdict (score) | Buy (+74) |
| Entry zone | 924.59 – 942.40 |
| Target 1 / 2 | 1,002.97 / 1,063.54 |
| Stop loss | 902.02 |
| Reward/risk | 1.5 / 3.0 |
Today's full Buy and Sell list for UK, Singapore & Hong Kong stocks →
Disclaimer: This technical analysis is generated automatically from exchange data and indicators calculated by JournalArta, for information and education only. The verdict and the entry, target and stop-loss levels are not investment advice or a solicitation to buy or sell any security. Investment decisions and their risks rest solely with the reader.
Track Prudential share price daily: live levels, support/resistance and our full Prudential analysis history.
 Take the quizWhat Kind of Holiday Spender Are You? Take the Black Friday QuizStart →





 Lifestyle · Food & HealthWhat Is Raynaud’s Syndrome? Why Fingers Turn White in the Cold
 Lifestyle · Food & Health4 Ways Walking After Meals Helps Your Body, Doctors Say
 Lifestyle · Food & Health4 Reasons to Eat Oatmeal, According to Nutrition Experts
 Lifestyle7 Signs Your Social Battery Is Running Low (and Why You Keep Cancelling Plans)