Intertek Share Price Update: Little Changed, Near a 3-Month High
Technical analysis of Intertek stock on November 19, 2026: price 5,945.00 GBp, trend sideways, RSI 60.2, support 5,920.00, resistance 5,965.00.

Why Intertek is in focus today
Selected automatically from 10 LSE (UK) stocks by a technical-signal score with daily weighted randomisation — not a recommendation.
Trend & Price Action
The structure leans positive without being dynamic. The 20-day average has risen 0.11% over the past five days, a slow drift rather than a surge, and its position above the 50-day average keeps the medium-term configuration constructive. There is no fresh moving-average crossover in the data — the last cross is not a new event this session — so momentum is being carried by trend persistence rather than a new trigger. Intertek sits at 56% of its 20-day range, with support at 5,920.00 and resistance at 5,965.00. That resistance level is also the three-month high, and the low of 5,835.00 marks the floor of the recent band. The stock is closer to the top of its box than the bottom, but it has not yet challenged the ceiling.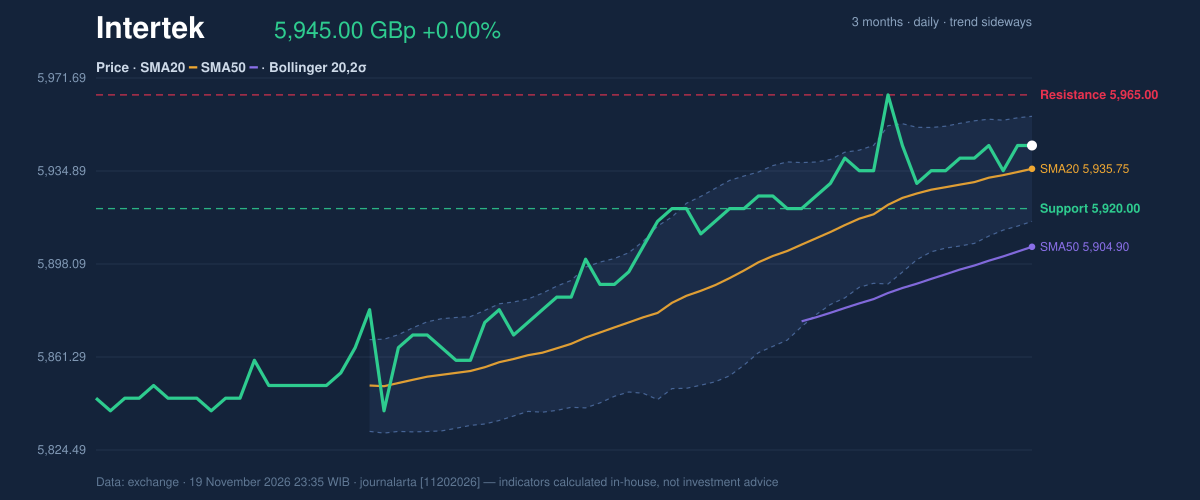
Oscillators & Momentum
Momentum is where the picture gets muddier. The 14-day Relative Strength Index stands at 60.2, squarely in neutral territory — below the 70 threshold that would flag overheating, but above the 50 line that separates strength from weakness. The stochastic oscillator is likewise neutral, with %K at 50.0 and %D at 46.3, showing no strong directional bias. The divergence comes from MACD. Its line at 10.527 sits below the signal line at 12.054, producing a negative histogram of -1.528. That is a bearish momentum reading against a still-positive trend — a warning that recent upward drift is losing force even as the price holds its ground.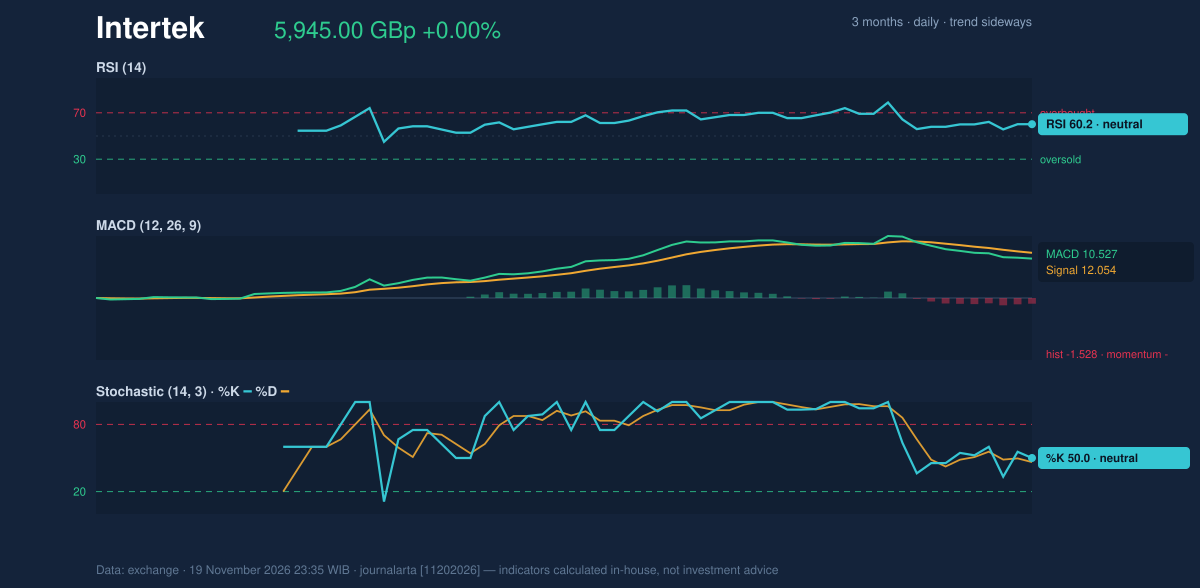
Volatility & Volume
Volatility is compressed. Average True Range is 12.86, or just 0.2% of the price, a very low reading that tells traders the stock is moving in tight increments. The Bollinger %B of 72% places price in the upper part of the bands, with the upper band at 5,956.55 and the lower at 5,914.95. When bands this narrow begin to widen, moves tend to be sharper than the recent tape would suggest. Volume is the more notable signal. Thursday's turnover of 226,658 shares was just 0.3 times the 20-day average of 789,467 — a thin session. Thin volume can exaggerate price moves and weaken the reliability of breakouts, and the On-Balance Volume line is falling, suggesting distribution despite the flat price.Key Levels & Scenarios
The actionable lines are clear. A sustained move above 5,965.00 would clear the three-month high and, with bands tight, could open a faster run. A break below 5,920.00 would put the 50-day average at 5,904.90 in play, and losing that would undermine the constructive trend.Technical Verdict: BUY
The JournalArta verdict is BUY, with a score of +66 on a −100 to +100 scale. The supporting evidence: price sits above its 50-day average, the 20-day average is above the 50-day, RSI at 60.2 sits in the healthy 50–70 zone, and the signal set shows one bullish reading (a pullback to the SMA20 within an uptrend) against zero bearish ones. The risks are the negative MACD histogram and falling OBV. The verdict is invalidated if price breaks below 5,917.38.- Entry range: 5,935.20 – 5,945.00
- Target 1: 5,986.43
- Target 2: 6,027.86
- Stop loss: 5,917.38
- Reward/risk: 1.5 / 3.0, valid until 17 December 2026
Summary Data Intertek
| Last price | 5,945.00 GBp |
| Change 1 day / 5 days / 1 month | 0.00% / 0.08% / 0.42% |
| Trend / MA-cross | sideways / none |
| SMA20 / SMA50 | 5,935.75 / 5,904.90 |
| RSI (14) / Stochastic %K | 60.2 / 50.0 |
| Bollinger %B / ATR | 72% / 12.86 |
| Support / Resistance 20 days | 5,920.00 / 5,965.00 |
| Data as of | 19 November 2026 23:35 WIB |
| JournalArta research verdict (score) | Buy (+66) |
| Entry zone | 5,935.20 – 5,945.00 |
| Target 1 / 2 | 5,986.43 / 6,027.86 |
| Stop loss | 5,917.38 |
| Reward/risk | 1.5 / 3.0 |
Today's full Buy and Sell list for UK, Singapore & Hong Kong stocks →
Disclaimer: This technical analysis is generated automatically from exchange data and indicators calculated by JournalArta, for information and education only. The verdict and the entry, target and stop-loss levels are not investment advice or a solicitation to buy or sell any security. Investment decisions and their risks rest solely with the reader.
Track Intertek share price daily: live levels, support/resistance and our full Intertek analysis history.
 Take the quizWhat Kind of Holiday Spender Are You? Take the Black Friday QuizStart →





 Lifestyle · Food & HealthWhat Is Raynaud’s Syndrome? Why Fingers Turn White in the Cold
 Lifestyle · Food & Health4 Ways Walking After Meals Helps Your Body, Doctors Say
 Lifestyle · Food & Health4 Reasons to Eat Oatmeal, According to Nutrition Experts
 Lifestyle7 Signs Your Social Battery Is Running Low (and Why You Keep Cancelling Plans)