JPMorgan Chase (JPM) Stock Falls 1.20%: Near a 3-Month Low
Technical analysis of JPM stock on November 19, 2026: price 320.22 USD, trend downtrend, RSI 35.8, support 320.22, resistance 352.11.
Why JPM is in focus today
Selected automatically from 11 NYSE (US) stocks by a technical-signal score with daily weighted randomisation — not a recommendation.
Trend & Price Action
The trend structure is unambiguously negative. The stock trades below its 20-day average of $337.64 and its 50-day average of $338.26, and the 20-day average is itself slipping — down 0.32% over five sessions. There is no fresh moving-average cross to point to, because the 20-day already sits below the 50-day; the bearish alignment was established before this session and is now being confirmed by price.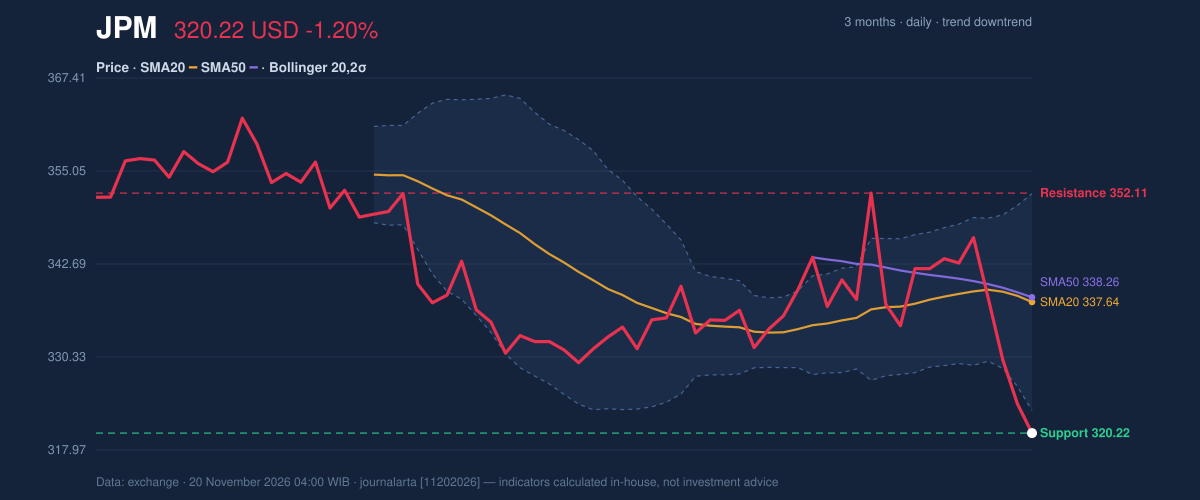
Oscillators & Momentum
Momentum indicators are stretched but not yet repairing. The 14-day RSI at 35.8 is neutral — not oversold, and therefore not offering a contrarian signal. The Stochastic is far more extended, with %K at 6.6 and %D at 3.9, deep in oversold territory. That divergence between a neutral RSI and a washed-out Stochastic tells you the selling has been sharp and recent rather than a slow grind — the kind of move that can bounce mechanically without changing the trend.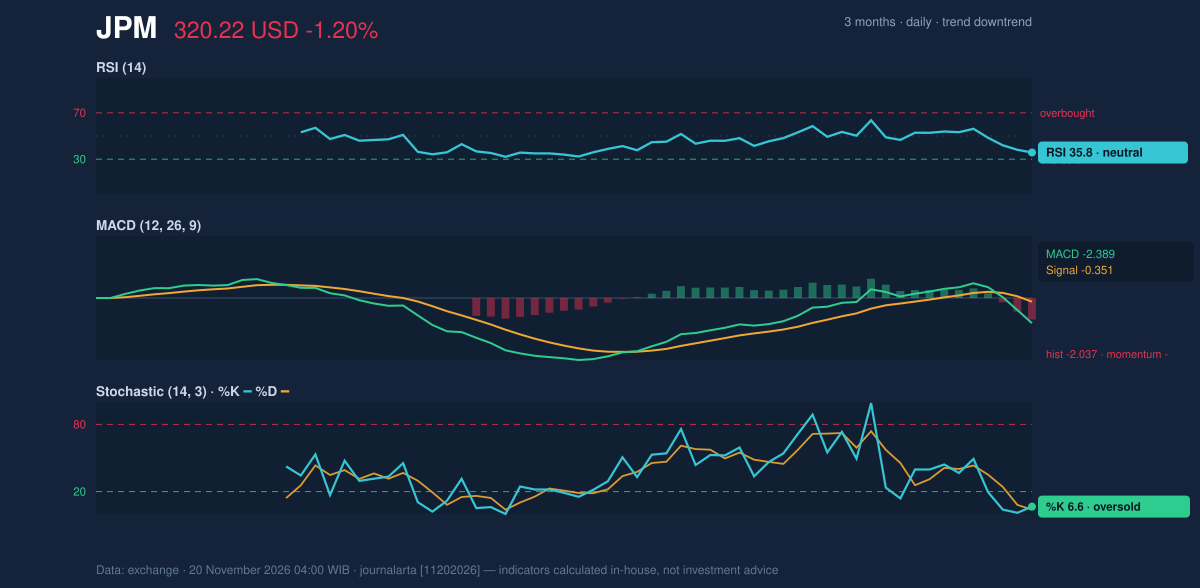
Volatility & Volume
The ATR of 8.55 — about 2.7% of the share price — describes moderate volatility. Combined with a normal-width Bollinger band, this is not a volatility spike; it is a directional slide within a normal operating range. That distinction matters: a low-volatility breakdown tends to persist because it reflects steady repositioning rather than a one-day shock. The falling OBV, noted above, reinforces that this is sustained selling rather than a single outsized print.Fundamental Context
The technical weakness sits against a solid operating backdrop. According to its SEC filing, JPMorgan reported quarterly revenue of $50.17 billion for the quarter ended September 30, 2026, up 8.1% from $46.43 billion a year earlier, with net income of $15.31 billion and diluted earnings per share of $5.57. The bank also filed a Form 8-K on November 17, 2026, reporting a change of directors or officers — a governance item that can weigh on sentiment independent of earnings. The gap between improving fundamentals and a deteriorating chart is exactly what makes the technical picture worth watching: the market is pricing something the income statement does not yet show.Key Levels & Scenarios
The levels are tight and consequential. Support sits at $320.22, the session close and the 20-day range floor. A decisive break below that — with the 3-month low at $317.43 as the next reference — would open the path toward the deeper targets in the JournalArta framework, $298.41 and $276.60. Conversely, if the stock reclaims $323.24, the lower Bollinger band, the immediate outside-band condition would resolve and a retest of the $337.64 20-day average becomes the logical first hurdle. Resistance at $352.11 is the level that would be needed to neutralize the downtrend.Technical Verdict: SELL
The verdict is SELL, consistent with the JournalArta Research verdict of -84 on a -100 to +100 scale — zero bullish versus three bearish technical signals. Three reasons carry the call: the MACD histogram has just turned negative with both components already below zero, signaling accelerating downside momentum; the Bollinger squeeze has resolved with a close below the lower band, a textbook breakdown; and the downtrend is confirmed by falling OBV, meaning volume is backing the decline rather than contradicting it. The verdict is invalidated if price breaks above the stop at $334.76. - Sell zone: $320.22 – $326.63 - Target 1: $298.41 - Target 2: $276.60 - Stop loss: $334.76 - Reward/risk: 1.5 / 3.0 - Valid until: December 18, 2026 In plain English: the chart says the sellers are still in charge, and the stock would need to climb back above roughly $335 to prove them wrong. The next scheduled catalyst is the December 18, 2026 validity date on the JournalArta framework, by which point the stock will have had a full month to either hold $320.22 or confirm the breakdown.Summary Data JPM
| Last price | 320.22 USD |
| Change 1 day / 5 days / 1 month | -1.20% / -6.59% / -4.85% |
| Trend / MA-cross | downtrend / none |
| SMA20 / SMA50 | 337.64 / 338.26 |
| RSI (14) / Stochastic %K | 35.8 / 6.6 |
| Bollinger %B / ATR | -10% / 8.55 |
| Support / Resistance 20 days | 320.22 / 352.11 |
| Data as of | 20 November 2026 04:00 WIB |
| JournalArta research verdict (score) | Sell (-84) |
| Sell zone | 320.22 – 326.63 |
| Target 1 / 2 | 298.41 / 276.60 |
| Stop loss | 334.76 |
| Reward/risk | 1.5 / 3.0 |
Today's full Buy and Sell list for US stocks →
Disclaimer: This technical analysis is generated automatically from exchange data and indicators calculated by JournalArta, for information and education only. The verdict and the entry, target and stop-loss levels are not investment advice or a solicitation to buy or sell any security. Investment decisions and their risks rest solely with the reader.
Track JPM stock price daily: live levels, support/resistance and our full JPM analysis history.
 Take the quizWhat Kind of Holiday Spender Are You? Take the Black Friday QuizStart →





 Lifestyle · Food & HealthNormal Blood Pressure Chart by Age: Healthy Ranges Explained
 Lifestyle · Food & HealthWhat Is Raynaud’s Syndrome? Why Fingers Turn White in the Cold
 Lifestyle · Food & Health4 Ways Walking After Meals Helps Your Body, Doctors Say
 Lifestyle · Food & Health4 Reasons to Eat Oatmeal, According to Nutrition Experts