United Parcel Service (UPS) Stock on Thursday: Falls 1.73%, Down 1.2% in Five Sessions
Technical analysis of UPS stock on November 19, 2026: price 109.11 USD, trend uptrend, RSI 55.2, support 100.32, resistance 114.31.

Why UPS is in focus today
Selected automatically from 11 NYSE (US) stocks by a technical-signal score with daily weighted randomisation — not a recommendation.
Trend & Price Action
The 20-day and 50-day simple moving averages tell an unusually clean story. The 20-day SMA sits at $109.04 — almost exactly where the last session closed — while the 50-day line sits at $101.41, well beneath the price. That is a textbook uptrend structure, and the 20-day average has been rising, climbing 2.84% over the past five sessions. No new moving-average cross has formed, meaning the uptrend has neither been refreshed nor broken. The stock carved a three-month range between a low of $91.56 and a high of $114.97, and it currently sits at roughly 63% of the 20-day range, nearer the ceiling than the floor. The relevant support is $100.32; the 20-day resistance is $114.31.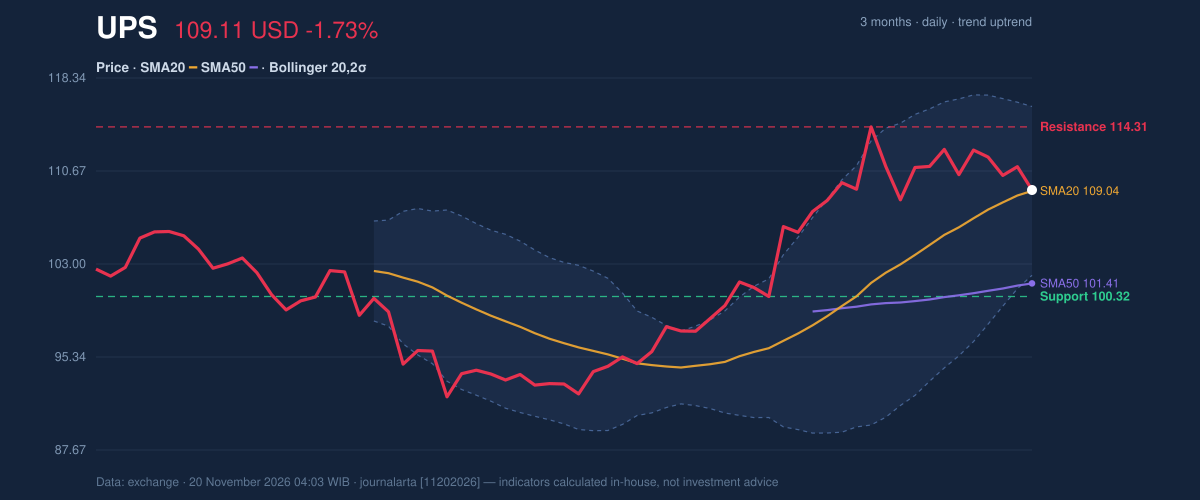
Oscillators & Momentum
The RSI(14) reads 55.2, squarely in the neutral 50–70 band and below the 65 threshold it recently crossed on the way down. That is a stock digesting gains rather than a stock in trouble. Short-term momentum, however, is flashing caution. Stochastic %K has collapsed to 14.2 against %D at 37.7, a deeply oversold reading that often precedes a rebound. Contradicting that — at least in the near term — is the MACD, where the line at 2.801 has dipped below its signal at 3.203, leaving a negative histogram of −0.402. The oscillator mix, as shown in the momentum chart, is the crux of the entire setup: oversold stochastic says the selling may be nearly exhausted, while the MACD says momentum has only just begun to fade.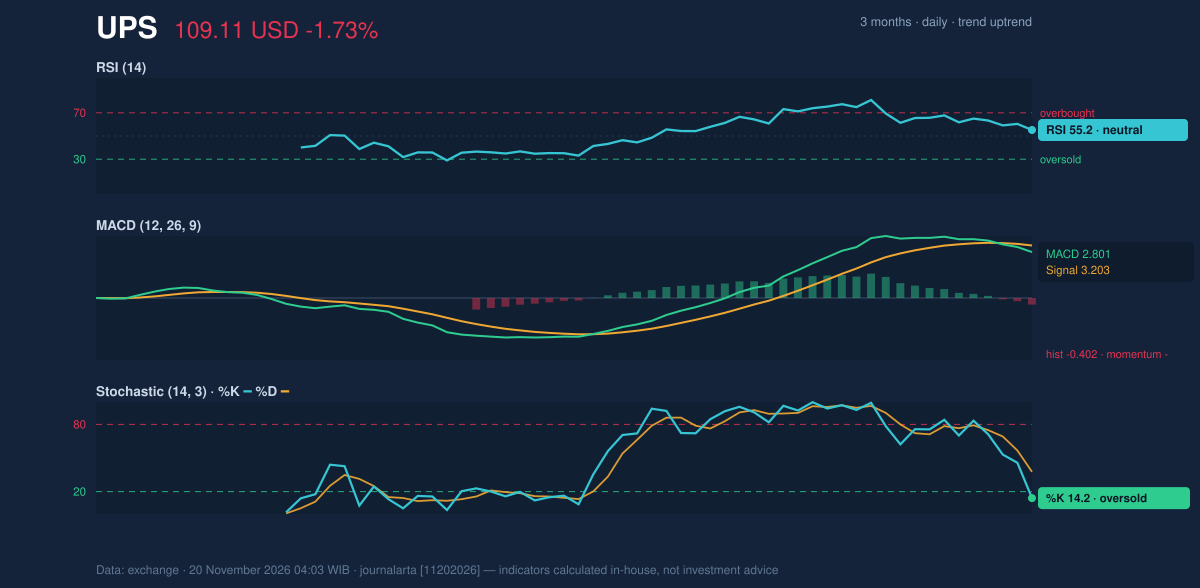
Volatility & Volume
The Bollinger bands run from $102.08 to $116.00 on a 12.8% width — a normal reading that suggests no squeeze is brewing and no breakout is imminent. The price occupies 51% of that band (a %B of 51%), placing it almost exactly at the middle line, which is where trends tend to pause. ATR(14) sits at $2.76, or 2.5% of the price — moderate volatility. The telling detail is volume: the last session traded 6.63 million shares, about 1.1 times the 20-day average, with the On-Balance Volume line pointing lower. Heavier-than-usual selling into a normal pullback is a mild warning, not a rout. It suggests sellers are active but not overwhelming.Key Levels & Scenarios
The setup resolves around two numbers. If price closes above the $114.31 20-day resistance — the doorstep to the $114.97 three-month high — the uptrend reasserts and the pullback looks like a launchpad. If instead it breaks $100.32, the 50-day average at $101.41 is the next structural floor, and a close beneath that would invalidate the trend thesis. Between the two, the price sits 1.5× ATR from $104.97 on the downside and $113.25 on the upside — a reminder that a single session cannot bridge either gap.Fundamental Context
The earnings strip adds ballast. Revenue for the quarter ended September 30 rose 6.7% to $22.85 billion from $21.42 billion a year earlier, according to its SEC filing, yet net income fell to $1.16 billion from $1.31 billion, with diluted earnings per share of $1.37. Top-line growth with slipping profit means the market is pricing margin pressure, not demand collapse — a backdrop that keeps the stock rangebound rather than directional.Technical Verdict: HOLD (wait & see)
The evidence supports patience rather than conviction. First, the trend is intact — price sits above both averages, and the 20-day average is rising. Second, momentum is mixed: the oversold stochastic argues against a fresh short, while the negative MACD histogram argues against a fresh long. Third, the stock is mid-band, barely changed from the 20-day average that also serves as Bollinger's center line — a classic no-man's-land.- Upside scenario: a daily close above $114.31 opens the path to the $114.97 three-month high.
- Downside scenario: a close below $100.32 threatens the 50-day average at $101.41.
- Stop-loss protection: beneath $104.97, the price minus 1.5× ATR, using the $100.32 support as the line in the sand.
- Invalidation: the verdict is void if price closes above $114.31 or below $100.32 with confirming volume.
Summary Data UPS
| Last price | 109.11 USD |
| Change 1 day / 5 days / 1 month | -1.73% / -1.15% / 7.48% |
| Trend / MA-cross | uptrend / none |
| SMA20 / SMA50 | 109.04 / 101.41 |
| RSI (14) / Stochastic %K | 55.2 / 14.2 |
| Bollinger %B / ATR | 51% / 2.76 |
| Support / Resistance 20 days | 100.32 / 114.31 |
| Data as of | 20 November 2026 04:03 WIB |
| JournalArta research verdict (score) | Hold (+50) |
Today's full Buy and Sell list for US stocks →
Disclaimer: This technical analysis is generated automatically from exchange data and indicators calculated by JournalArta, for information and education only. The verdict and the entry, target and stop-loss levels are not investment advice or a solicitation to buy or sell any security. Investment decisions and their risks rest solely with the reader.
Track UPS stock price daily: live levels, support/resistance and our full UPS analysis history.
 Take the quizWhat Kind of Holiday Spender Are You? Take the Black Friday QuizStart →





 Lifestyle · Food & HealthNormal Blood Pressure Chart by Age: Healthy Ranges Explained
 Lifestyle · Food & HealthWhat Is Raynaud’s Syndrome? Why Fingers Turn White in the Cold
 Lifestyle · Food & Health4 Ways Walking After Meals Helps Your Body, Doctors Say
 Lifestyle · Food & Health4 Reasons to Eat Oatmeal, According to Nutrition Experts